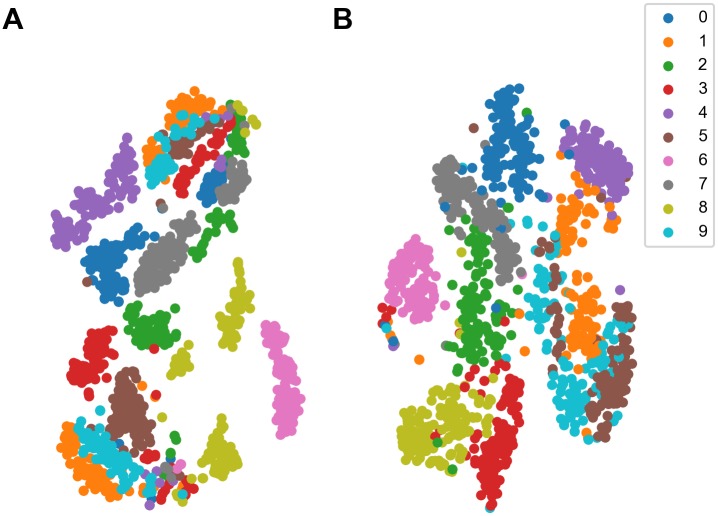
Fig 8. Visualization of MFSC features and SNN output with t-SNE.
All samples are color-coded according to their digit classes. (A) The t-SNE visualization of MFSC features. Most digit classes have more than one cluster. (B) The t-SNE visualization of SNN output. The processing of SNN makes the clusters of each digit merged or closer.

