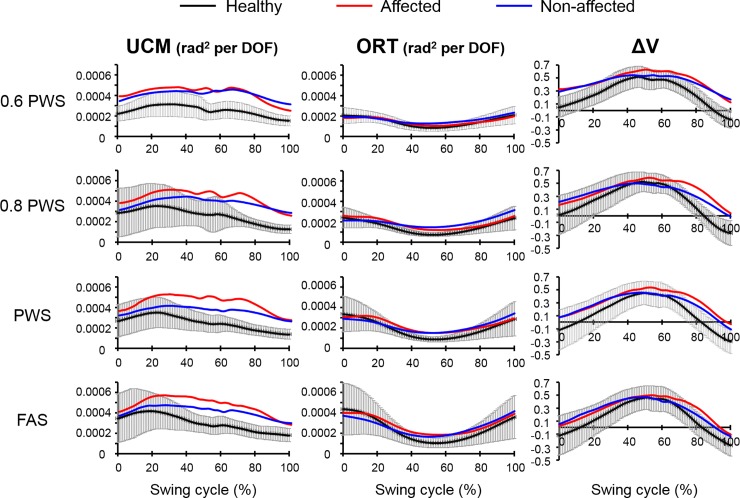
Fig 2. UCM variables across the entire swing phase for healthy controls (black line), stroke affected leg (red line), and stroke unaffected leg (blue line) at four different speeds which are 60%, 80% and 100% of their preferred walking speed (PWS) and the fastest attainable speed (FAS).
Error bars (in grey) are ± 1 STD of data in healthy group.

