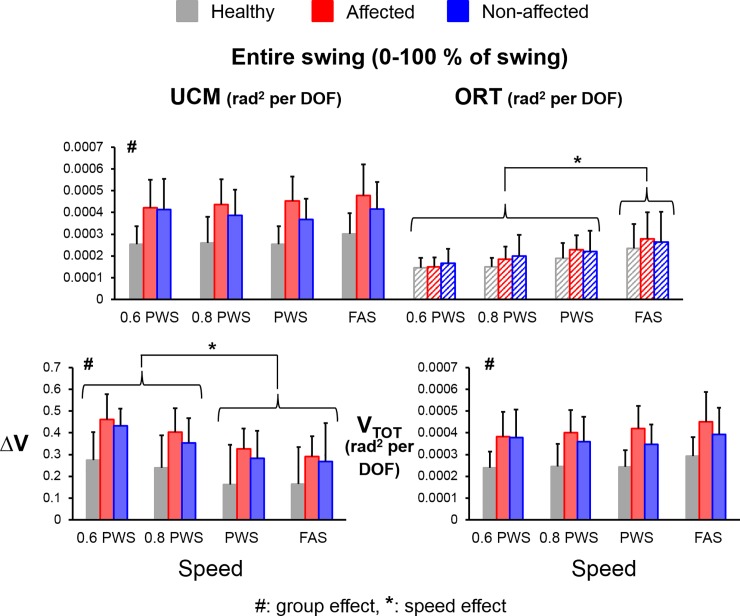
Fig 3. Average values of UCM variables across the entire swing phase (VUCM-whole, VORT-whole, ΔVwhole and VTOT-whole) for healthy controls (grey bars), stroke affected leg (red bars), and stroke unaffected leg (blue bars).
Error bars represent 1 STD. # indicates significant difference between stroke and control groups. * indicates significant difference between different speeds.

