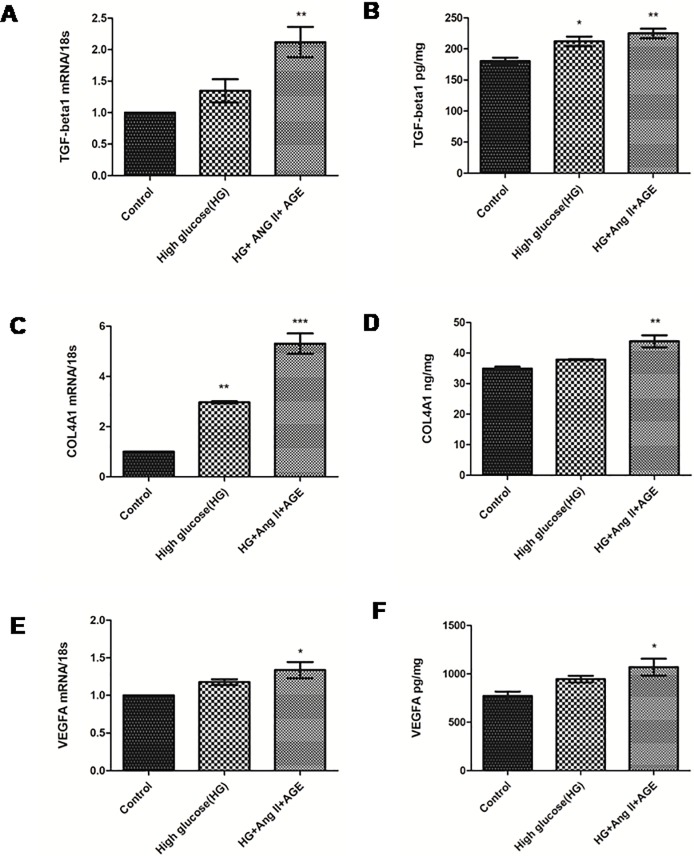
Fig 2. Effect of high glucose, angiotensin II and AGE on RPTECs.
A and B: Assessment of mRNA expression profiles and protein levels of TGF-β1 in control, HG and cells treated with HG (30 mM), Ang II (1 μM) and AGE products (150 μg/ml) respectively. C and D: Assessment of mRNA expression profiles and protein levels of VEGF-A in control and cells treated with HG (30 mM), Ang II (1 μM) and AGE product (150 μg/ml) respectively and E: Assessment of mRNA level and protein level of Col4A1 in control and cells treated with HG (30 mM), Ang II (1 μM) and AGE product (150 μg/ml) respectively. Results are represented as mean ± S.D. (n = 3), *p<0.05, **p < 0.01, ***p < 0.001 which shows significant difference in comparison with control group.

