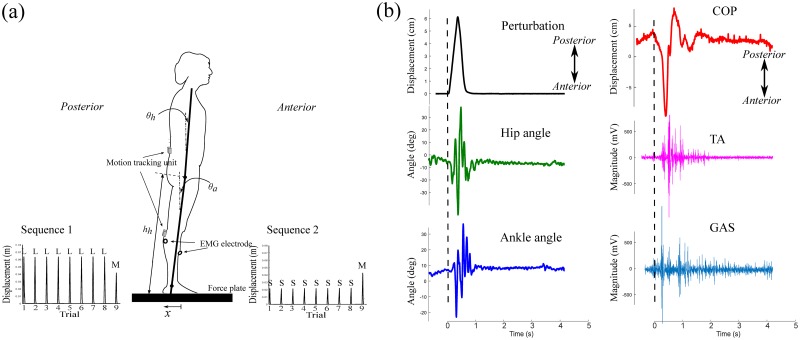
Fig 1.
(a) A schematic of the experimental setup and definitions of the ankle angle θa, hip angle θh, and hip height hh. Sequence 1 consists of 8 perturbations of a large magnitude followed by one perturbation of a medium magnitude. Sequence 2 consists of 8 perturbations of a small magnitude followed by one perturbation of a medium magnitude. (b) Experimental data obtained from a representative participant for Trial 2 in Sequence 1: displacement of the force plate, hip and ankle angles, COP, and EMG signals from the left leg. The dashed line indicates the time at the onset of the perturbation. All data are aligned to the dashed line.

