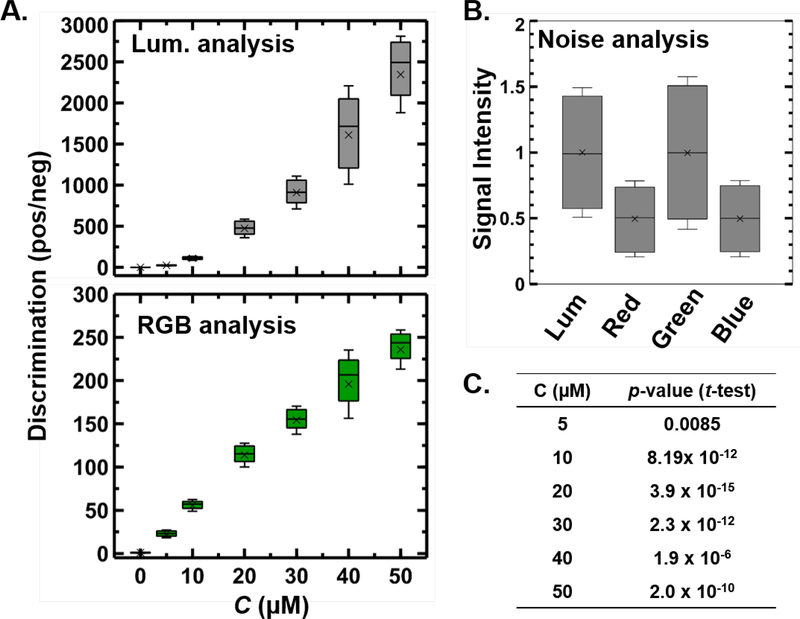
Fig 2. Comparison between Chromaticity-Luminance based analysis with RGB based analysis.
(A) Measuring the Luminance in CIE xyY color space significantly increases the dynamic range of fluorescent signals in comparison to green channel intensities in the RGB color space while (B) keeping the relative noise of the signal (no fluorescence) unaltered under luminance and RGB analysis. (C) p-values from t-test (two tail) compares the signal strength to the noise between the luminance and RGB distributions for samples with varying fluorescence emission (Null hypothesis: There is no statistically significant difference between the luminance and RGB sample sets). Discrimination is defined as the ratio of positive sample to the intensity of the sample with no fluorophore. In the box plots (A, B) the boundary of the box closest/furthest to the zero indicates 25th/75th percentile, black line and cross within the box indicate the median and mean respectively and whiskers above/below the box indicate 1 standard deviation of the distribution of over a 3 sample replicate and 1000 pixels analysis (3000 data points for each distribution).

