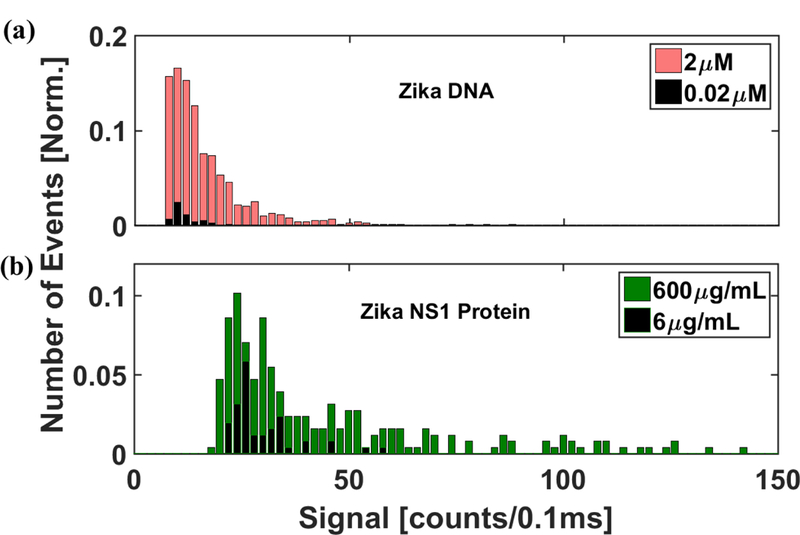
Figure 5: Distribution of signal strengths for Zika DNA and protein assays at different analyte concentrations in human serum.

(a) Histogram of the signal strength of the bead based Zika nucleic acid assays detected at 2μM and 0.02 μM sample concentrations in human serum. (b) Histogram of the signal strength of the bead based Zika NS1 protein assays detected at 600μg/mL and 6 μg/mL sample concentrations in human serum. The distribution was normalized with respect to the total number of events detected from the higher concentration assays. The distribution of protein assays shows higher average signal strength as compared to the nucleic acids. Both the total number of events and the signal strength were found to be reduced at lower concentrations for both the assays.
