
Figure 6: Target differentiation through dual protein-nucleic acid assay:
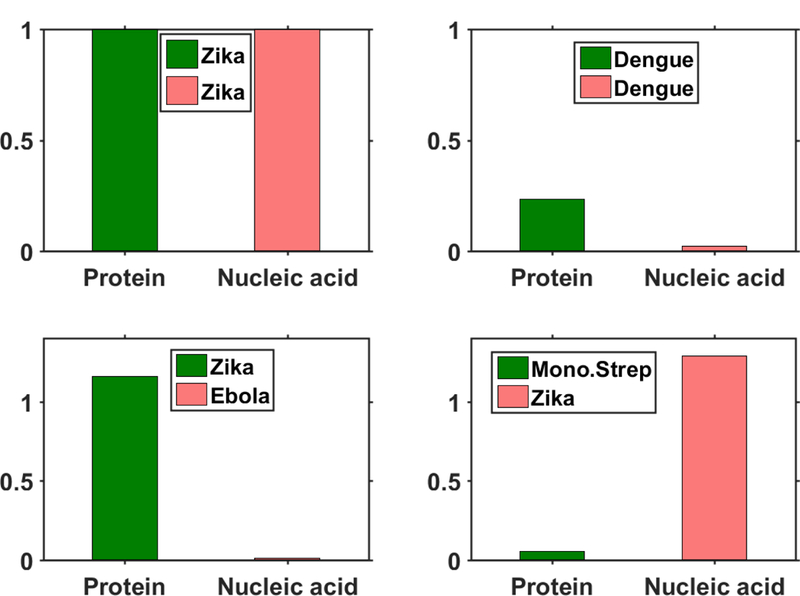
Bar plots indicate relative number of peaks observed in the protein (green) and nucleic acid (red) channel in each of the 4 separate tests. Each bar plot is normalized with respect to the number of peaks observed with Zika nucleic acid and protein targets. Very few peaks are seen when the wrong nucleic acid (Ebola) target and wrong protein (Monovalent Streptavidin) targets are introduced. However, a significant signal is observed with dengue protein targets due to cross reactivity with Zika NS1 antibodies, but the low signal in the nucleic acid channel confirms the absence of the Zika target.