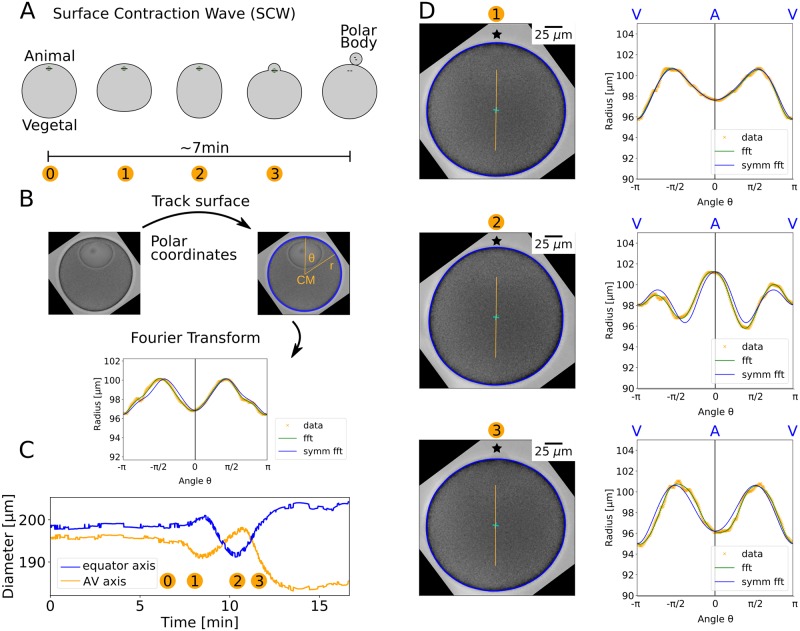
Fig 2. Quantification of SCW in 2D.
A: We consider 2D slices through the cell volume containing the AV-axis. The SCW takes about 7 min to run over the surface. Different intermediate stages during the SCW are indicated by numbers. B: The cell contour (blue rim) was tracked with image analysis methods from transmission light microscopy images. It was then described in polar coordinates with the contour centre of mass as coordinate origin. To smooth the curve, higher Fourier modes were discarded (fft). The symmetry of the radius function was used to determine the orientation of the AV-axis and the signal was symmetrised around it (symm fft). C: The diameter of the oocyte at the AV-axis develops from a minimum via a maximum to a minimum, whereas the diameter on the perpendicular axis towards the equator shows the opposite behaviour, as expected from A. D: The radius function was defined with respect to the centre of mass (cyan cross). The AV-axis is marked as an orange line and the animal pole by a star. The surface of the oocyte shows high symmetry during different stages of the SCW. The difference between the smoothed radius function (green line, fft) and its symmetrised version (blue line, symm fft) is very small. In stages 1 and 4 there are local minima at the animal pole whereas in stage 2 we found a local maximum. A video of the SCW is given as S3 Video.

