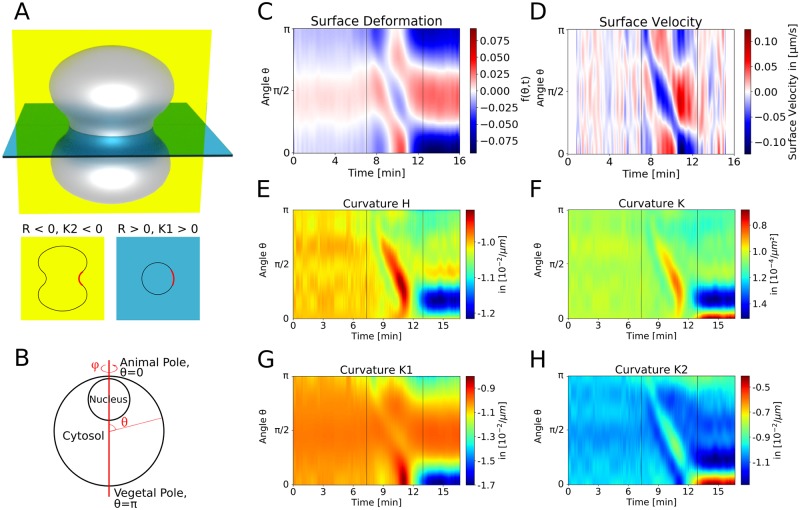
Fig 3. Dynamics of surface displacements and curvatures during the SCW.
A: Cartoon of a cell with invaginated shape. For each direction at each point on the surface, a curvature (the inverse of the local curvature radius) can be defined. Here the two principal curvatures of the rotationally symmetric surface at the equator are shown as K2 in the yellow plane and K1 in the blue plane. At the same point they have opposite signs (red section). B: The starfish oocyte is assumed to be rotationally symmetric around the AV-axis. This makes it possible to calculate the three-dimensional shape from two-dimensional images. Thus we have access to the full set of curvatures. C,D: The normalised deformation from a perfect spherical shape (C) and the radial surface velocity (D) clearly define the SCW-speed. E-H: The kymographs of mean curvature (H), Gaussian curvature (K) and the two curvatures in φ-direction (K1) and in θ-direction (K2) confirm that the SCW can be described as a band of local flattening running over the oocyte. Evaluation of the Gaussian curvature K demonstrates that the surface transiently evolves towards a saddle shape.

