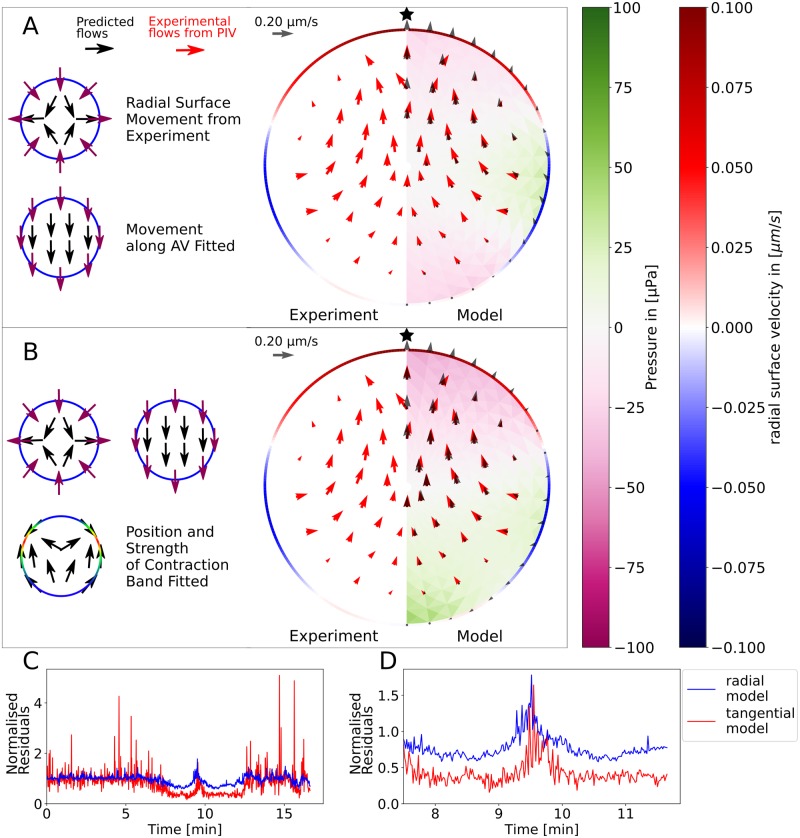
Fig 7. Comparison of the hydrodynamic model with experimental flows.
A: The experimentally measured flows (red arrows) are compared with flows predicted by the hydrodynamic model (black arrows). The hydrodynamic model also predicts the internal pressure field (purple to green colours) that is experimentally not accessible. The model is based only on the radial surface movement obtained from experiment (red to blue rim). Whole body movement parallel to the AV-axis is fitted. B: The model’s accuracy can be improved by taking into account tangential surface movement as an effect of local surface contraction. Now the position and the strength of the contraction band are fitted for each time step individually. Videos of the SCW predicted by the radial and tangential displacement models, respectively, are given as S5 and S8 Videos. C,D: The quality of the tangential displacement model quantified by the normalized residuals is significantly better during the wave (C whole time course, D zoom in to wave).

