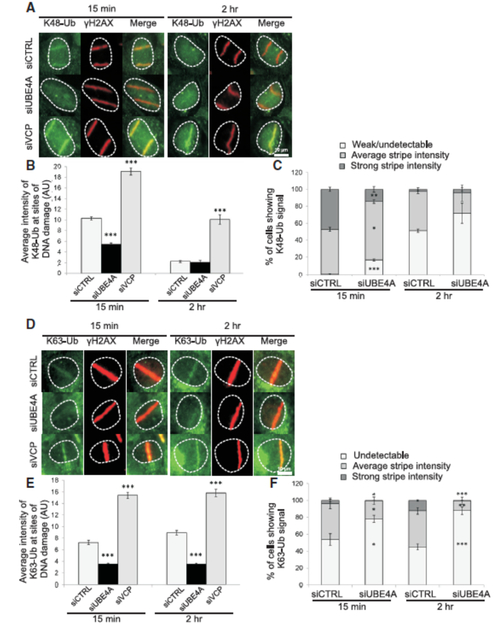
Figure 4. UBE4A is required for timely and quantitatively proper assembly of ubiquitin chains at sites of DNA damage.
(A) Cells were transfected with the indicated siRNAs, and localized DNA damage was induced using a focused laser microbeam. The cells were fixed 15 min or 2 hr later and stained with antibodies against γH2AX and K48-Ub. (B) The accumulation of K48-Ub was quantified according to the fluorescence intensity obtained using the corresponding antibody on top of γH2AX stripes. The immunoblot shows the extent of UBE4A depletion in tis experiment. (C) K48-Ub lines were classified as ‘strong’, ‘average’ or ‘weak/undetectable’. (D-F) Similar analysis as in (A-C) for K63-linked ubiquitin chains. AU - arbitrary units. Quantified data in B and C are represented as mean ± SEM (3 independent experiments, n>70), and in E and F as mean ± SEM (4 independent experiments, n>80). *p<0.05, ** p<0.005, *** p-<0.0005 (student's t-test, relative to the siCTRL). (See also Figures S6 and S7).

