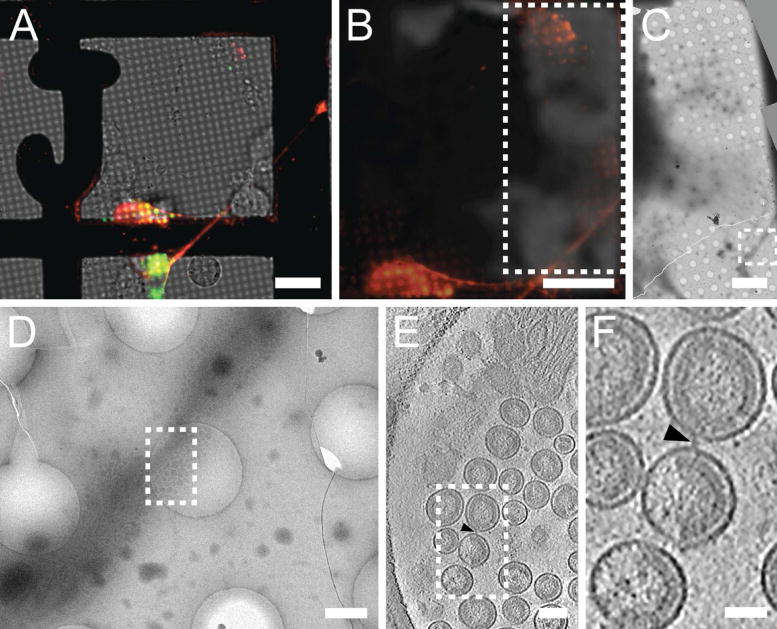
Figure 6. CLEM imaging of transfected mammalian cells provides multi-scale information.

HT1080 cells grown on a gold London Finder grid and transfected with EGFP-tetherin (green) and mCherry-Gag (red) were imaged by live cell fluorescence microscopy (A and B), then plunge frozen and imaged by cryo-EM montaging (C and D), and cryo-ET (E and F). The mCherry-Gag (red) signal in (A) and (B) corresponds to electron density of a thin cellular extension in (C) and (D). The black arrowheads in (E) and (F) indicate a tether attaching 2 VLPs. Dashed boxes correspond to the enlarged image in the next panel. Adapted from Strauss et al. (Strauss, et al., 2016). Scale bars, (A and B) 25 μm, (C) 10 μm, (D) 500 nm, (E) 100 nm, and (F) 50 nm.
