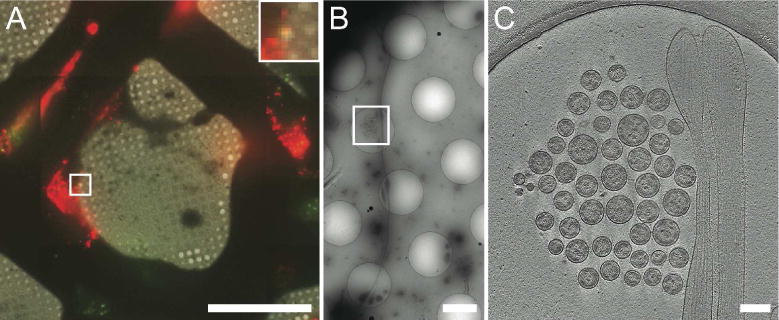
Figure 7. Cryo-CLEM imaging of transfected mammalian cells.

HT1080 cells transfected with EGFP-tetherin (green) and mCherry-Gag (red) imaged by cryo-fluorescence microscopy (A), cryo-EM montaging (B), and cryo-ET (C). Dashed boxes correspond to the enlarged image in the next panel. The yellow signal in (A) (inset) indicates colocalization of EGFP-tetherin (green) and mCherry-Gag (red) signal and corresponds to a cluster of HIV-1 VLPs tethered to a cellular extension in (B) and (C). Adapted from Hampton et al. (Hampton, et al., 2017). Scale bars, (A) 50 μm, inset is 3X, (B) 2 μm, (C) 200 nm.
