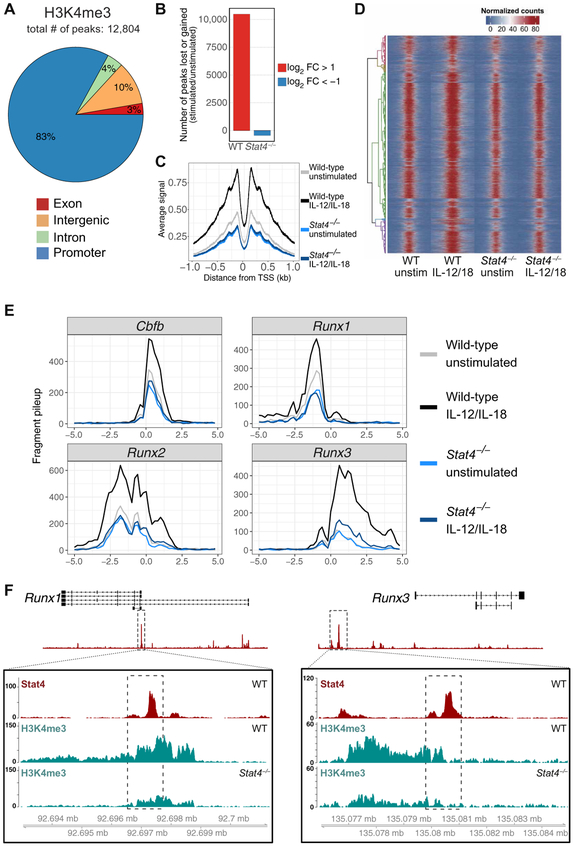
Fig. 2. STAT4 facilitates a permissive epigenetic landscape (H3K4me3) in activated NK cells.
Splenic NK cells (TCRβ−CD19−CD3ε−Ly6G−TER119−TCRγδ−NK1.1+) were isolated from WT and Stat4−/− mice and stimulated with IL-12 and IL-18 or media alone as a control (unstimulated; unstim). H3K4me3 ChIP was performed, followed by high-throughput DNA sequencing. (A) Global proportions of H3K4me3 permissive marks at promoter, intronic, exonic, or distal inter-genic regions in cytokine-stimulated NK cells are shown. (B) Bar plots depict number of peaks that change on the basis of fold change (FC) of stimulated versus unstimulated NK cells. FC was calculated by taking the difference between log2-transformed normalized counts for each condition. Only peaks that showed a log2 FC greater than a magnitude of 1 were counted. (C) Meta-peak of all H3K4me3 promoter regions. Overlap of midpoints of ChIP fragments (defined as regions between properly paired sequence reads) for each TSS region was counted for each base pair ± 1 kb from the transcriptional start site. Line plot depicts average signal for all regions for each base pair. (D) Heat map of all H3K4me3 binding regions, with each row representing a single-peak region, row-clustered by normalized peak counts. Signal is displayed as normalized read counts over 5 kb centered at the peak region and is binned at 100-bp windows. (E) H3K4me3 signals from Cbfb, Runx1, Runx2, and Runx3 loci plotted as normalized fragment counts binned at 200 bp across a 10-kb window centered on the transcriptional start site. (F) Zoomed-in histograms of STAT4 ChIP and H3K4me3 ChIP reads mapped to Runx1 and Runx3 loci. Dashed box within boxed tracks indicate STAT4 ChIP called peak region. Data are representative of two independent experiments with n = 15 to 20 pooled mice per group per experiment.

