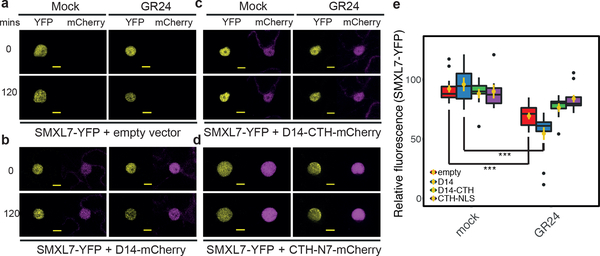
Figure 5. SMXL7-GFP Stability in response to GR24 and D3-CTH expression.
(a)–(d) Representative images of SMXL7 levels in response to GR24 application in tobacco epidermal cells. Levels of SMXL7-YFP (yellow) at 0 and 120 minutes post treatment are shown for single nuclei co-expressing empty vector (a), D14-mCherry (b), D14-CTH-mCherry (c), or CTH-NLS-mCherry (d) – all displayed in magenta. bars = 10 μm. (e) Relative SMXL7 abundance at 2h post treatment comparing GR24 vs mock in cells expressing SMXL7-YFP alone or co-expressing SMXL7 and D14-mCherry, D14-CTH-mCherry or CTH-NLS-mCherry respectively. Yellow dots and bars are means ± sem (***: p < 0.001, n=7 [nuclei], two-tailed Student’s t-test, black dots: data > mean ± 3x s.d.). Coloured boxes represent central 50% of the distribution with median shown as a horizontal bar. Top and bottom vertical bars represent 75–100% and 0–25% data points, respectively. p values for empty vector, D14, D14-CTH, CTH-N7 are 1.294×10^−5, 7.188 ×10^−4, 4.401×10^−2, 3.86 ×10^−1 respectively.

