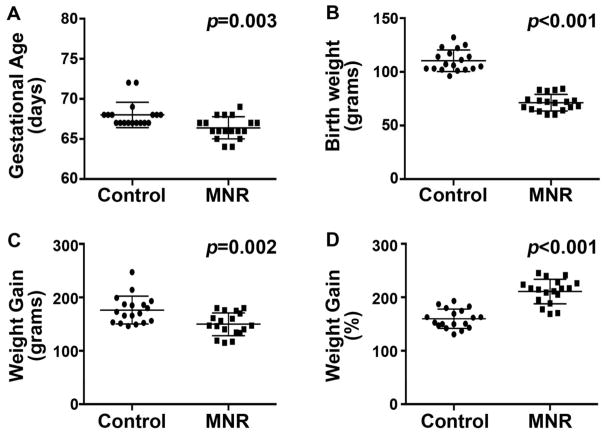
Figure 1. Descriptive characteristics of control and MNR birth cohorts.
A and B. Number of completed days of gestation at birth (A) and birth weight (B) for the control and MNR neonatal cohorts. C and D. Absolute weight gain (grams) (C) and relative weight gain (%) as a percent of birth weight (D) at four weeks of life for the control and MNR neonatal cohorts. Bars represent mean ± S.D. Analysis by Student’s t-test.

