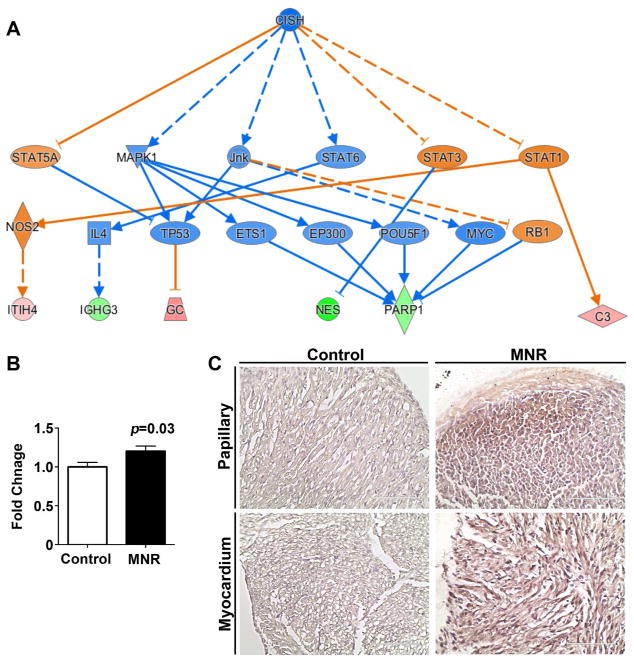
Figure 5. Strongest predicted causal network by IPA analysis of neonatal hearts.
A. Network contains differentially upregulated (green) and downregulated (red) proteins, as well as literature-inferred activation (blue) and inhibition (orange) proteins. Top functions of the genes were related to cellular proliferation, differentiation and survival. The node shapes denote triangle: kinase, fat diamond: peptidase, tall diamond: enzyme, rhomboid: transporter, oval: transcription regulator, circle: other. n=5 animals per group (1 animal per litter). B. Quantification of PARP-1 expression (RT-PCR) in whole hearts from fetal control (white bars) and MNR-FGR (black bars) animals. Data represent mean ± S.E.M. Analysis by Student’s t-test. C. Photomicrographs of papillary muscle and ventricular myocardium from control and MNR-FGR fetal hearts stained with anti-PARP1 antibody (brown) and counterstained with hematoxylin (blue). Scale bar equals 100μm.

