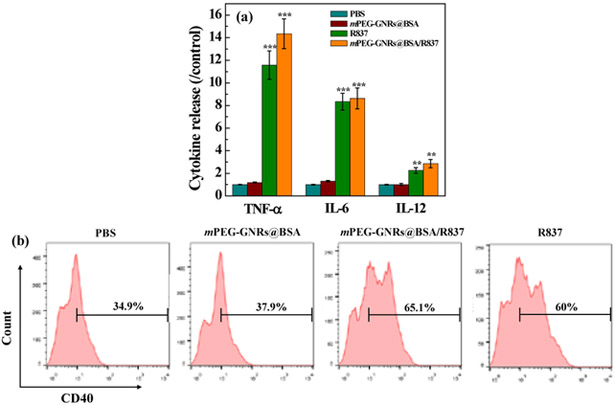
Fig. 3.
(a) Cytokine secretion release of TNF-α, IL–6 and IL–12 by DC2.4 cells treated with PBS, mPEG-GNRs@BSA, mPEG-GNRs@BSA/R837, or R837 ([Au] = 11.5 μg/mL, [R837] = 2 μg/mL) for 24 h (All data were compared with the PBS control). (b) Quantification of CD40 expression in BMDCs after different treatments ([Au] = 11.5 μg/mL, [R837] = 2 μg/mL) for 24 h by flow cytometry.

