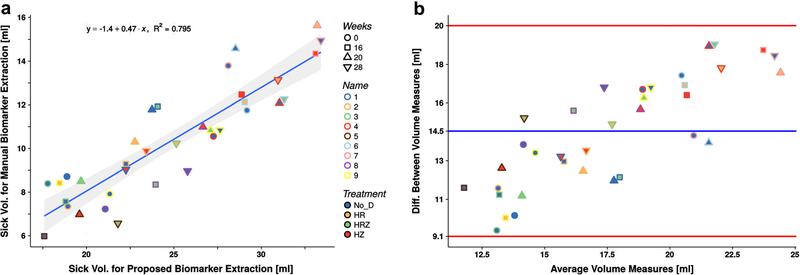
Fig. 3.
Biomarker evaluation. a Correlation between the biomarker (relative diseased volume) extracted manually and using the proposed method (R2 = 0.8, p < 10−4); the 95 % confidence interval is drawn as the shadow of the regression line. b The BlandAltman plot presents a good agreement between measures with the regression bias of 0.47.

