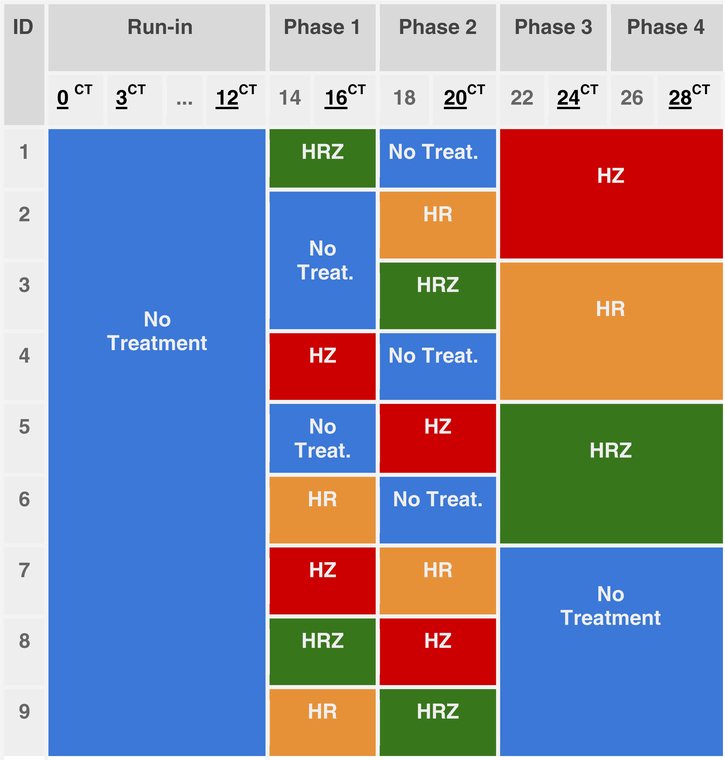
Table 1.
Antibiotic cocktail per week and subject. Each color represents the treatment (isoniazid (H), rifampicin (R), and pyrazinamide (Z)) taken by a subject during each treatment phase. Weeks with the CT superindex indicate the acquisition of a computed tomography volume at that week.
 |
