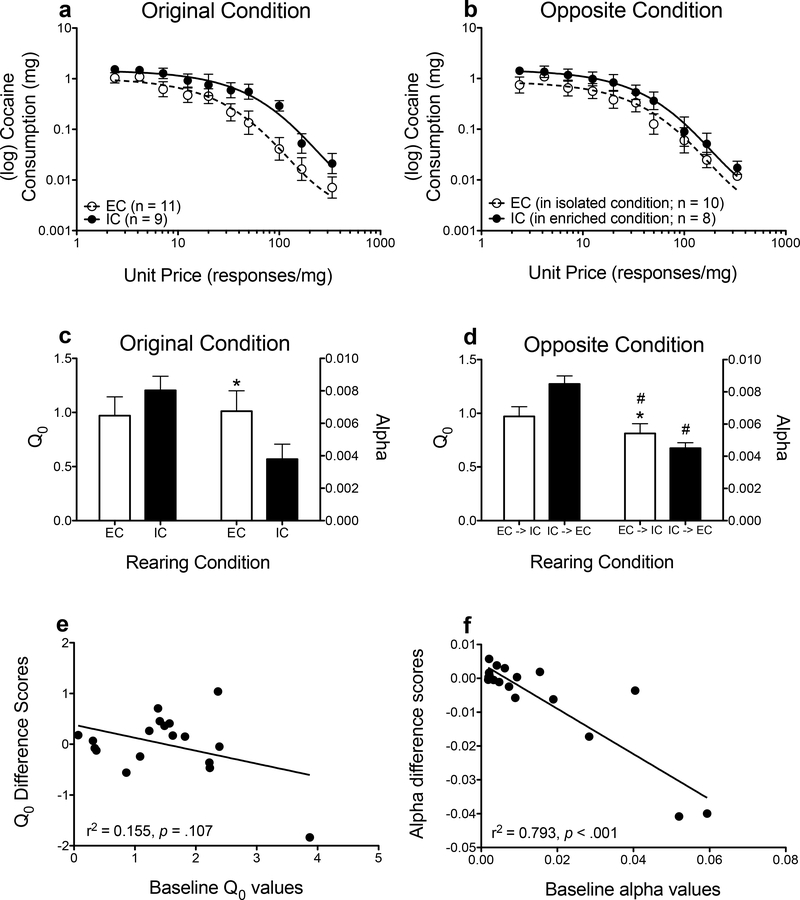
Figure 2.
Log mean consumption (± SEM) of cocaine in EC rats (n = 11 original condition; n = 10 opposite condition) and IC rats (n = 9 original condition; n = 8 opposite condition) in their original environment (a) and in the opposite environmental condition (b), plotted as a function of unit price. The lines (EC: dashed; IC: solid) indicate the best-fit curves from the demand function. Mean (± SEM) Q0 (left y-axis) and α (right y-axis) values derived from the demand function in the original (c) and opposite (d) environmental conditions. Correlations between baseline (in original environmental condition) values and differences scores (opposite environmental condition – original environmental condition) for Q0 (e) and α (f) values. *p<.05, relative to IC rats. #p <.05, relative to original housing condition.

