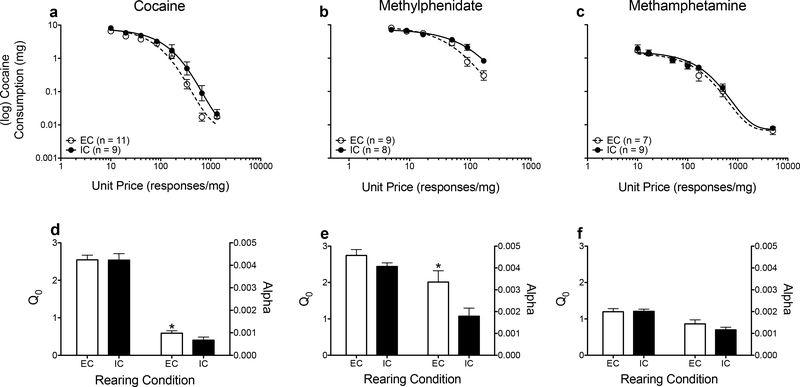
Figure 3.
Log mean consumption (± SEM) of cocaine (a), methylphenidate (b), and methamphetamine (c) in previous studies, plotted as a function of unit price. The lines (EC: dashed; IC: solid) indicate the best-fit curves from the demand function. Mean (± SEM) Q0 (left y-axis) and α (right y-axis) values derived from the demand function following self-administration of cocaine (d), methylphenidate (e) and methamphetamine (f). *p <.05, relative to IC rats. Note, panels were created using data from previously published work (Alvers et al. 2012; Green et al. 2010; Hofford et al. 2014). n = 7–11 per housing condition across experiments.

