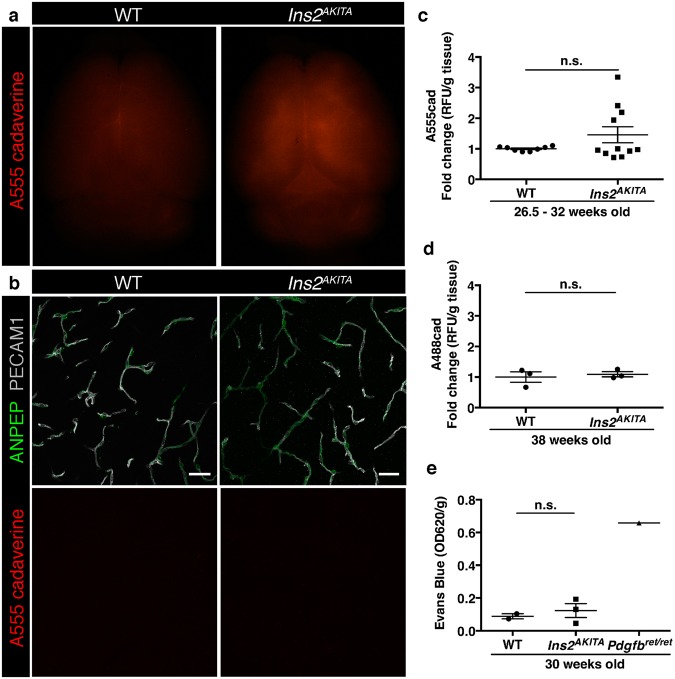
Figure 2.
Blood-brain barrier permeability measurements in male Ins2AKITA and WT littermate controls. (a) Representative stereomicroscope fluorescence images of brains showing 1 kDa Alexa Fluor 555 cadaverine permeability in Ins2AKITA and WT after 2 h of dye circulation (n = 2). (b) Representative confocal images of coronal sections of 1 kDa Alexa Fluor 555 cadaverine injected mouse brains. ANPEP positive mural cells, green; PECAM1 positive vasculature, white. No Alexa Fluor 555 cadaverine leakage into brain parenchyma was observed either in Ins2AKITA or WT mice (n = 2, scale bar 30 μm). (c) Quantification of 1 kDa Alexa Fluor 555 cadaverine permeability in 26.5–32 week-old Ins2AKITA and WT mice after 2 h circulation (n = > 8, 3 independent experiments). y-axis shows the fold change in relative fluorescence units (RFU) per gram of brain tissue in relation to WT. (d) Quantification of 1 kDa Alexa Fluor 488 cadaverine permeability in 38 week-old Ins2AKITA and WT mice after 2 h circulation (n = 3). y-axis shows the fold change in relative fluorescence units (RFU) per gram of brain tissue in relation to WT. (e) Evans Blue dye permeability in 30 week-old Ins2AKITA and WT littermate control mice after overnight circulation (n = > 2). y-axis shows optical density (OD) at 620 nm per gram of tissue. PdgfbRet/Ret served as positive control for tracer leakage into the brain parenchyma. n.s., not significant, student’s t test. Data is presented as mean ± SEM.

