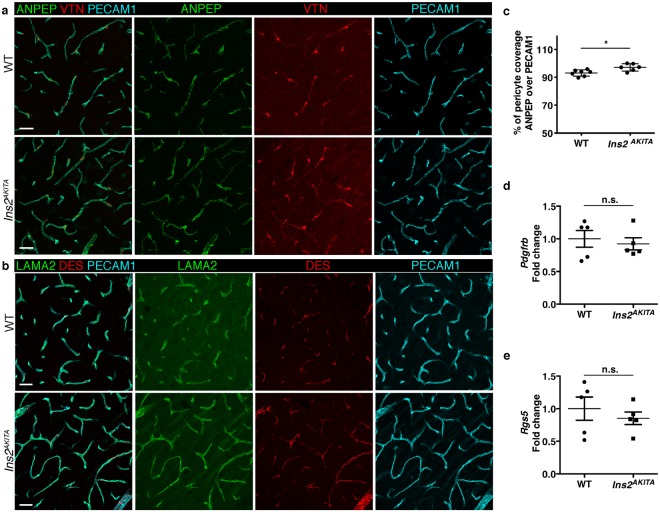
Figure 3.
Characterization of pericyte coverage and pericyte-specific gene and protein expression in 26.5–32 week-old Ins2AKITA and WT littermate controls. (a,b) Representative images of pericyte-specific protein expression in WT and Ins2AKITA mice, (a) Aminopeptidase N (ANPEP, green) and Vitronectin (VTN, red); (b) Laminin alpha 2 (LAMA2, green) and desmin (DES, red). Endothelium visualized with PECAM1, cyan. n = 2, scale bar 30 μm. (c) The skeletal length of PECAM1 positive capillaries and ANPEP positive pericytes in Ins2AKITA and WT was measured and plotted as the percentage of the pericyte length over vessel length (n = 6, *p = 0.0125, student’s t test). (d,e) qPCR analysis on isolated brain microvasculature fragments for pericyte-specific gene Pdgfrb (d) and Rgs5 (e). WT controls are set as 1 and Ins2AKITA results are presented as fold change over WT (n = 5). n.s. = not significant, student’s t test. Data is presented as mean ± SEM.

