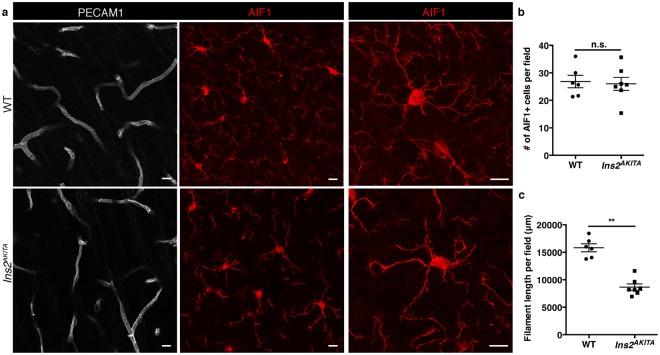
Figure 6.
Characterization of microglia in 26.5–32 week-old Ins2AKITA and WT littermate controls. (a) Representative images of microglia (AIF1, red) in Ins2AKITA and WT cerebral cortex. Vasculature is stained with anti-PECAM1 antibody. Notice the fewer microglial processes in Ins2AKITA cerebral cortex when compared to WT, scale bars 10 μm (n = 6). (b) Quantification of the number of AIF1 + microglia per field in WT and Ins2AKITA cerebral cortex (n = 6), n.s. = not significant, student’s t test. (c) Quantification of the microglial filament length per field (μm) (n = 6), **p = 0.0012, student’s t test.

