Fig. 2.
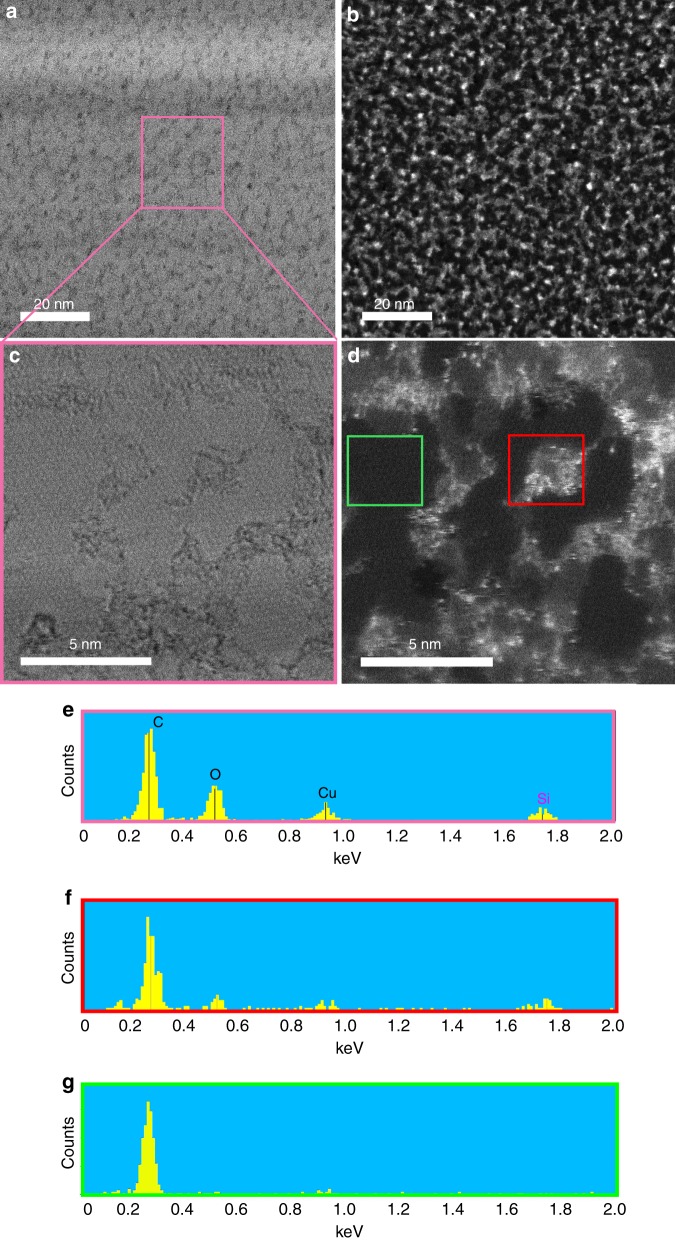
The extent of silicon-based contamination on the surface of typical graphene oxide derived from low-purity graphite (98% purity). a Bright-field (BF) image of a typical GO sheet. b HAADF image of a. c, d Details of BF and HAADF images of the marked region in a at higher magnification, respectively. Unlike the BF images in which Si contaminants are largely invisible, the HAADF images highlights them as bright clusters. e EDS spectrum of the entire region shown as pink box in a, c. The strong Si peak at 1.739 keV confirms the significant contamination in the GO sample. f, g A comparison of the EDS spectra of the contaminated area (f) and non-contaminated area (g), which are marked as red and green boxes in d, respectively

