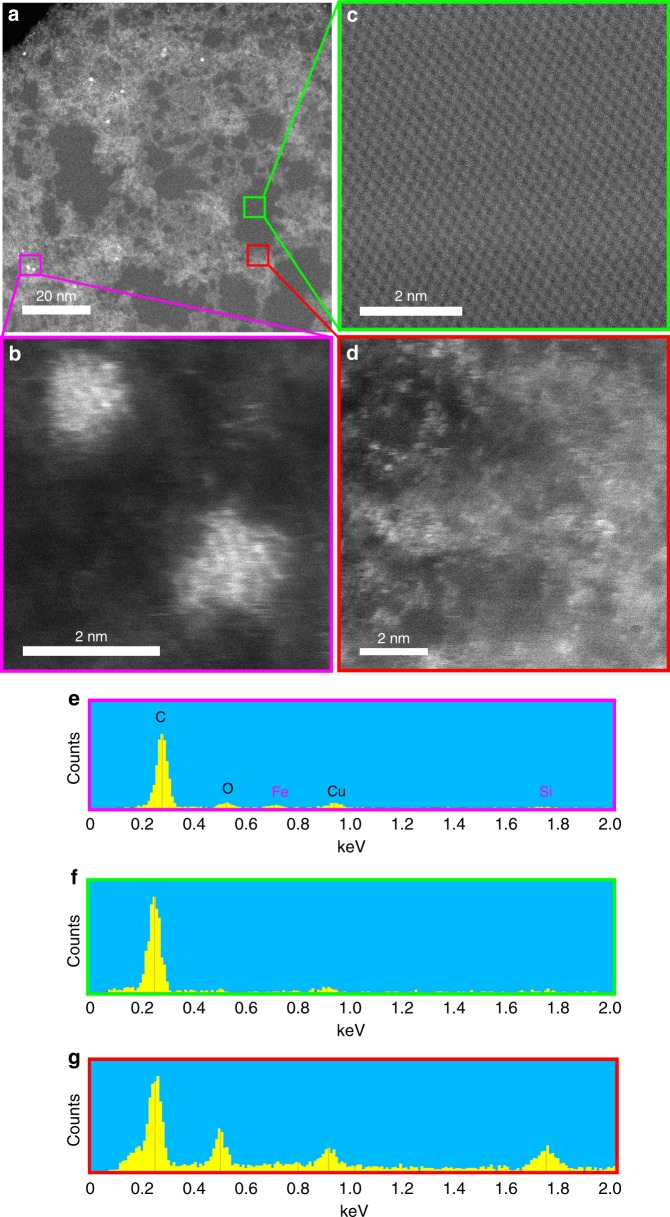
Fig. 4.
The extent of silicon contamination on the surface of typical low purity graphite (98% purity). a HAADF image of a typical graphite platelet. Details of the various boxed regions in a showing: b an iron contamination, c a clean area with a perfect graphitic lattice structure, and d a silicon contaminated area. e–g EDS spectra of b–d, respectively, showing iron contamination, clean graphene and silica contamination, respectively

