Fig. 7.
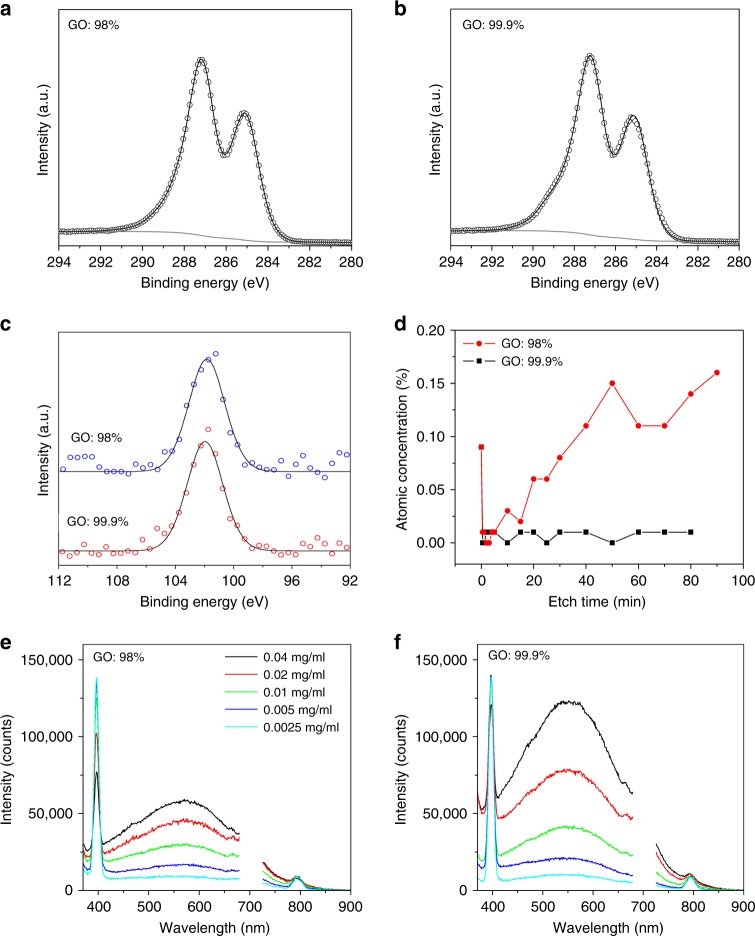
Characterisation of typical GO films and dispersions prepared from graphite feedstock of different purities. a, b Comparison of the XPS C 1s spectral region of GO films. c Comparison of the XPS Si 2p spectral region of GO films. d Comparison of the atomic concentration of silicon as a function of etching time. e, f Comparison of photoluminescence spectra (λexc = 350 nm) of GO dispersions in water as a function of solution concentration. The observed sharp peaks at 396 and 792 nm are due to the Raman peaks of water. The second-order diffraction peak at 700 nm has been removed for clarity

