Fig. 2.
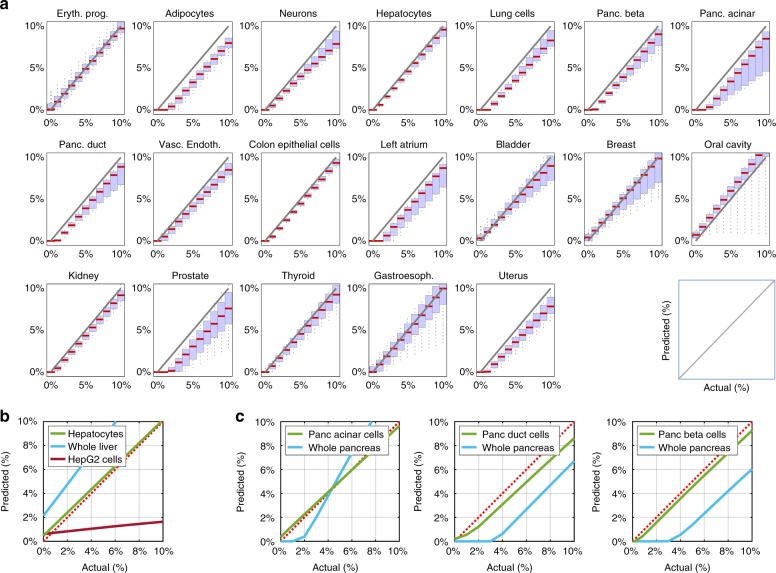
DNA methylation patterns allow for accurate deconvolution of simulated admixed samples. a The methylome of each cell type was mixed in silico with the methylome of leukocytes such that it contributed between 0 and 10% of DNA, in 1% intervals (x-axis of each plot) and compared to the prediction of deconvolution using our reference methylation atlas (y-axis). Red horizontal bars represent the median predicted contribution for each mixed-in level, across 36–180 replicates for each cell type (2–10 replicates of measured cell type methylomes, each mixed within any of 18 leukocyte replicates). The blue area represents a box plot spanning the 25th to 75th percentiles for each mixing ratio, with black vertical lines marking the 9th to 91st percentiles. b Primary tissue methylome allows a more accurate deconvolution than whole-tissue or a cell line. Hepatocyte methylome was mixed in silico with blood methylome as in a. The level of inferred admixture (y-axis) was calculated using a reference tissue methylome atlas that included other hepatocyte samples (green), whole liver methylomes (blue) or the methylome of the HepG2 cell line (red). Dotted red line marks accurate prediction. c Cell type-specific methylomes allow a more accurate deconvolution than whole tissue methylomes. The methylome of pancreatic acinar, duct, or beta cells was diluted in silico into leukocyte methylomes (left, middle, and right, respectively); the level of admixture was calculated using a comprehensive reference atlas that contained either independent samples of the spiked-in pancreas cell types (green lines), or a whole pancreas methylome (blue lines). Note assay linearity, but reduced sensitivity, when using a whole pancreas methylome

