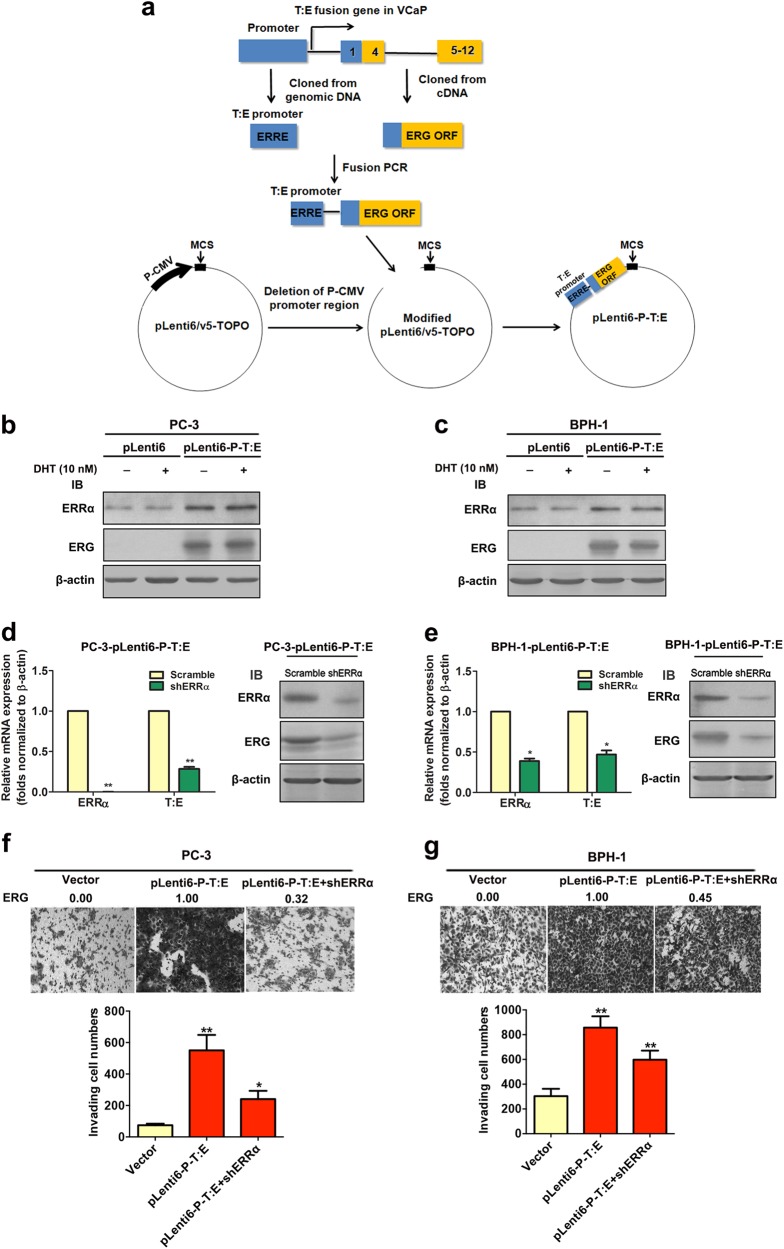
Fig. 6.
Enhanced invasion capacity mediated by ectopic T:E fusion or ERG in AR-negative prostatic cells is under ERRα regulation. a Schematic diagram shows the construction of the lentiviral plasmid expressing the T:E fusion or ERG under the regulation of ERRα. An approximate 2-kb fragment of the innate T:E fusion gene promoter including the P1 ERRα-binding element and the full-length open reading frame (ORF) of the T:E fusion gene was cloned from the genomic DNA and cDNA respectively from the T:E fusion-positive VCaP cells. The two DNA fragments were PCR-ligated and inserted into the modified CMV promoter-deleted lentiviral expression vector pLenti6-V5-TOPO as pLenti6-P-T:E. Under the regulation of its innate promoter containing the P1 ERRα-binding element, the generated pLenti6-P-T:E expresses the T:E fusion or ERG. b and c Immunoblot analyses of ERRα and ERG in T:E fusion stable infectants of PC-3 and BPH-1 cells. Results validated that ERG was expressed in both PC-3-T:E and BPH-1-T:E infectants, with no alteration upon dihydrotestosterone (DHT) treatment. d and e RT-qPCR and immunoblot analyses of ERRα and ERG in ERRα-knockdown T:E infectants. Results showed that both mRNA and protein levels of ERG were significantly reduced in both PC-3-T:E and BPH-1-T:E infectants upon shRNA-induced knockdown of ERRα. f and g Transwell invasion assay on PC-3-T:E and BPH-1-T:E infectants. Upper panels: representative images show the crystal violet-stained invading T:E infectants, magnification 100×. Analysis showed that both PC-3-T:E and BPH-1-T:E infectants exhibited significant higher invasion capacity than their control counterpart vector-infectants. The invasion capacities of both T:E infectants were significantly suppressed upon shRNA-induced knockdown of ERRα. Figures above the images indicate the relative expression levels of ERG in respective clones. *P < 0.05; **P < 0.01 versus empty vector-infectants, two-tailed Student’s t test. All data are presented as mean ± SEM obtained from three independent experiments

