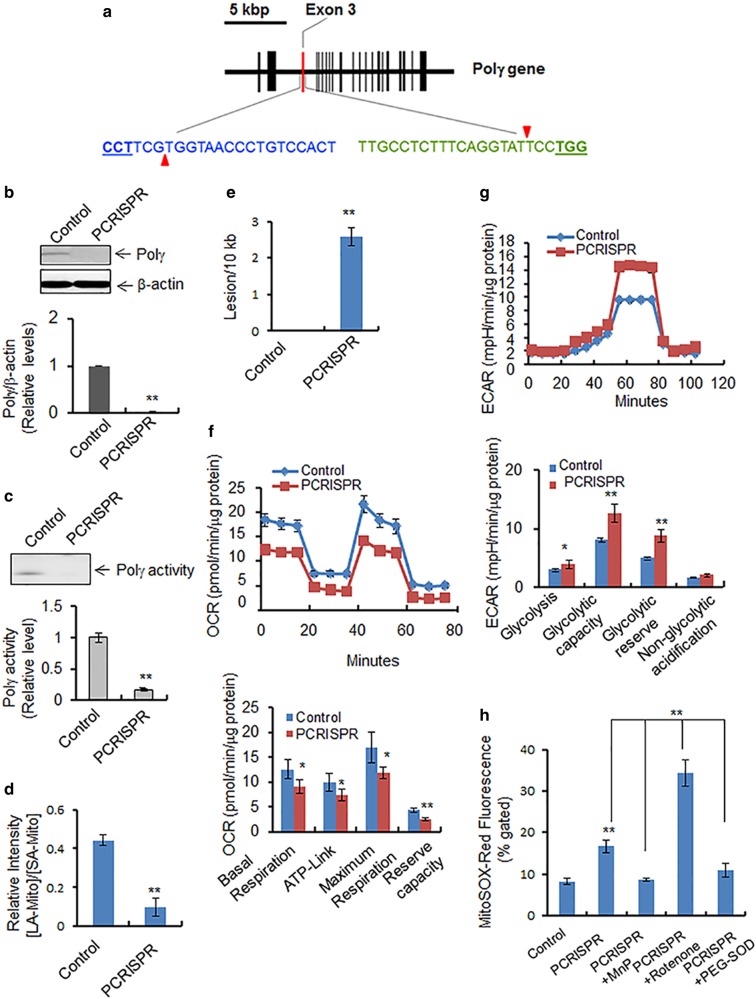
Fig. 2.
Effects of Polγ suppression on mitochondria. a The mouse Polγ gene structure in chromosome 7 is shown schematically. The vertical bars indicate the exons. The exon 3 targeted by CRISPR is highlighted in red. Two 20-nucleotide guide sequences of CRISPR are shown, in blue and in green. The pam sequences are underlined, and red triangles indicate the incision sites by Cas9n. b Polγ protein levels were measured by western blotting in PCRISPR JB6 clones. c Polγ activity in mitochondria isolated from PCRISPR cells was detected by primer extension followed by autoradiography (see Materials and methods). d The PCR product ratio of long-amplicon (LA) mtDNA to short-amplicon (SA) mtDNA in control and Polγ-deficient PCRISPR cells which is normalized by mitochondrial mass. e The number of DNA lesions per 10 kb mtDNA in Polγ-deficient PCRISPR cells following normalization with mitochondrial mass. Note that the mitochondrial masses of control and PCRISPR cells were obtained by staining the cells with NAO, a mitochondria-specific dye, followed by flow cytometry. f Mitochondrial oxygen consumption was measured as described in Materials and Methods. OCR oxygen consumption rate. g Glycolysis was measured as described in Materials and Methods. ECAR extracellular acidification rate. h The level of mitochondrial reactive oxygen was measured by quantifying the MitoSox Red fluorescence in Polγ-deficient PCRISPR cells in the presence and absence of MnP (MnTnBuOE-2-PyP5+), with positive and negative controls. The mean fluorescence intensity of MitoSox Red was determined using flow cytometry. The concentration of cellular superoxide was estimated by quantification of fluorescence intensity. Rotenone was used as a positive control for generation of ROS. PEG-SOD (Superoxide dismutase–polyethylene glycol from bovine erythrocytes) was also used as a control to remove superoxide generated by MitoSox Red. The fluorescence intensity of MitoSox Red is normalized by total mitochondrial mass. In all bar graphs and line graphs, each data point represents the mean ± SD of three individual samples. Each experiment was repeated at least three times and statistical analysis was performed using t tests for two groups or one-way ANOVA analysis and Bonferroni’s post-test for multiple-group comparisons. Statistical significance is indicated by asterisks: *p < 0.05 and **p < 0.01

