Fig. 3.
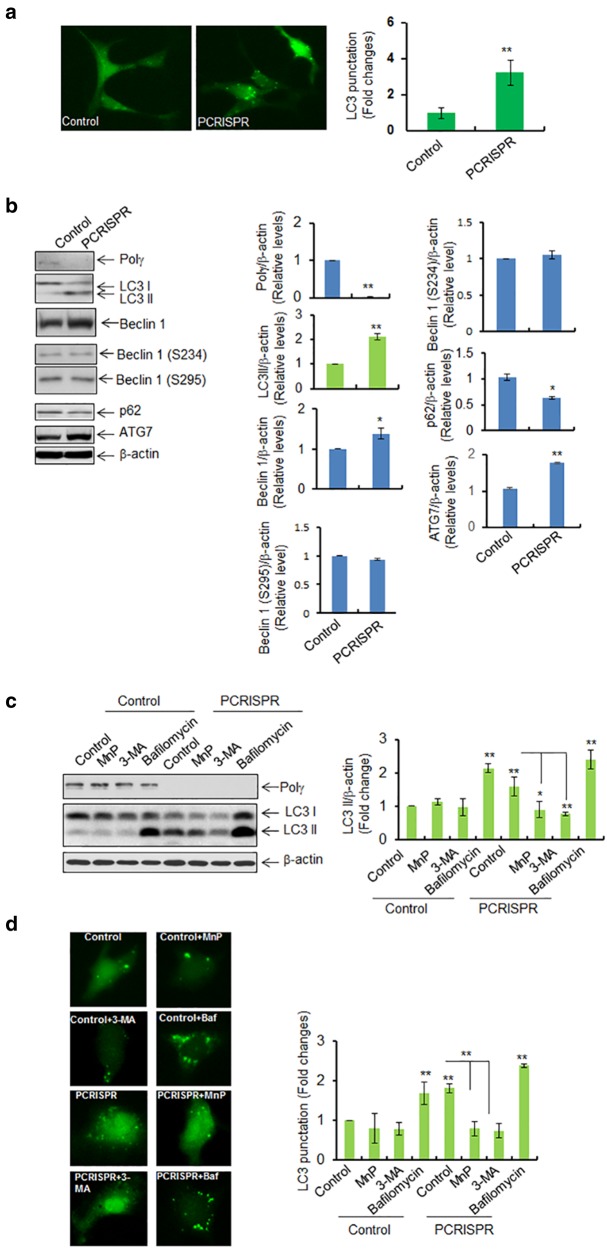
Suppression of Polγ increases the autophagic response. a LC3 punctation was detected in Polγ-deficient PCRISPR cells following expression of GFP-LC3. For each cell type, 100 GFP-positive cells were counted, and the right panel shows the quantification of punctated cells. b Western blot analysis and quantification of the increase in LC3 II, beclin 1, phosphorylated beclin 1, ATG7, and the decrease in p62 in Polγ-deficient PCRISPR cells compared to controls. c Autophagy flux was detected by western blotting in PCRISPR cells following treatment with autophagy inhibitors (MnP; MnTnBuOE-2-PyP5+ 3-MA; 3-methyle adenine and Bafilomycin). The bar graph shows the quantification of LC3 II band intensity normalized to β-actin. d LC3 punctation was detected using fluorescence microscopy with or without autophagy inhibitors. The bar graph shows the quantification of punctated cells (100 GFP-positive cells were counted for each cell type). In all panels, each experiment was repeated at least three times. In the bar graphs, each data point represents the mean ± SD of three individual samples. Statistical analysis was performed using t tests for two groups or one-way ANOVA analysis and Bonferroni’s post-test for multiple-group comparisons. Statistical significance is indicated by asterisks: *p < 0.05 and **p < 0.01

