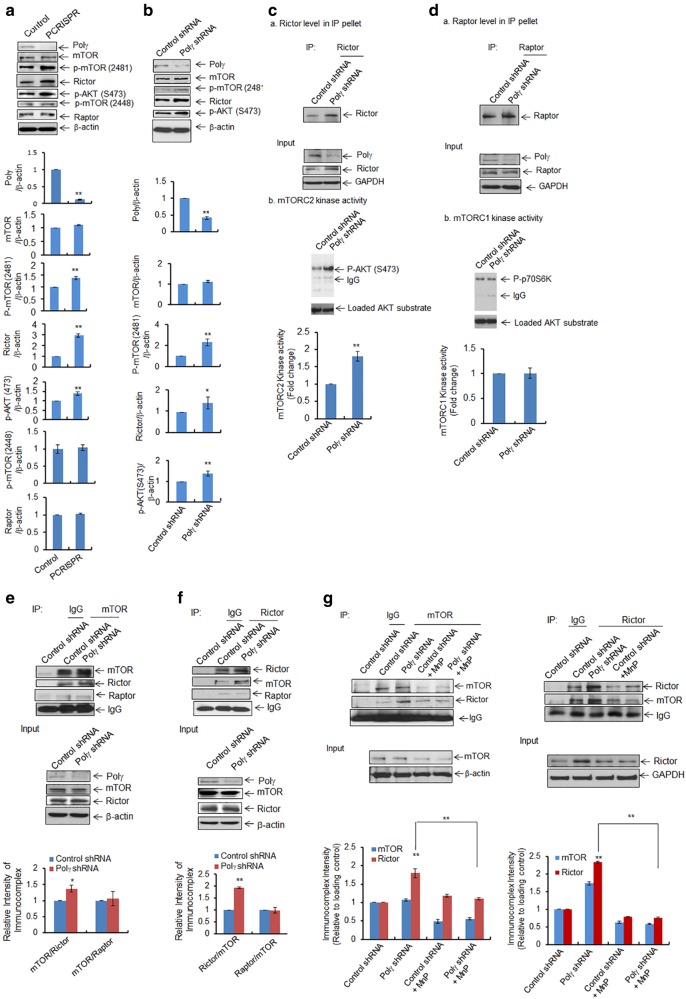
Fig. 5.
Activation of AKT/mTOR pathway following Polγ deficiency. a, b Increased levels of mTOR phosphorylation at S2481, AKT phosphorylation at S473, and Rictor were detected by western blotting in a Polγ-deficient PCRISPR cells and b cells stably expressing Polγ shRNA. c, d In vitro mTOR kinase activities were measured by using specific substrates for mTOR complexes coupled with immunoprecipitation and western blotting in cells stably expressing Polγ shRNA. c For mTORC2 kinase activity, total cell lysates were immunoprecipitated with Rictor antibody. Panel a The immunoprecipitated proteins were detected by western blotting using Rictor antibody. Panel b Immunoprecipitated product was then incubated with purified AKT. The phosphorylated AKT (S473) was detected as an indicator of mTORC2 kinase activity. d, Panel a The immunoprecipitated proteins were detected by western blotting using Raptor antibody. For mTORC1 kinase activity, total cell lysates were immunoprecipitated with raptor antibody. Immunoprecipitated product was then incubated with purified p70S6K protein and the phosphorylated p70S6K was detected by western blotting as an indicator of mTORC1 activity. e Coimmunoprecipitation of Rictor and Raptor with mTOR from the total cell lysates of cells expressing Polγ shRNA. Input controls are provided as loading control. f Reverse coimmunoprecipitation with Rictor antibody followed by western blotting performed with Rictor, mTOR, and Raptor antibodies. Input controls were provided as loading control. g Immunoprecipitation was also carried out using mTOR antibody in JB6 cells stably expressing Polγ shRNA following pretreatment with MnP (20 μM × 24 h). The immunoprecipitated products were analyzed by western blotting using antibodies against mTOR and Rictor. Input controls were added as loading control. Similarly, reverse immunoprecipitation was performed using Rictor antibody in Polγ-deficient cells following pretreatment with MnP. Input controls are also shown as loading control. All immunoprecipitated proteins were normalized with house-keeping loading control and quantified. Each experiment was repeated at least three times. In the bar graphs, each data point represents the mean ± SD of three individual samples. Statistical analysis was performed using t tests for two groups or one-way ANOVA analysis and Bonferroni’s post-test for multiple-group comparisons. Statistical significance is indicated by asterisks: *p < 0.05 and **p < 0.01

