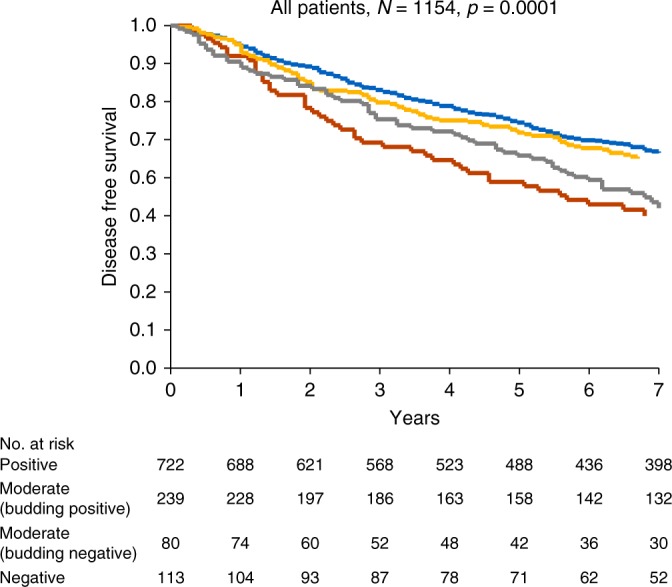
Fig. 3.

Disease-free survival curves for the combined cohort. Blue represents CDX2-positive, yellow CDX2-moderate with preserved expression of CDX2 in the budding cells, red CDX2-moderate with lost expression of CDX2 in the budding cells and grey CDX2-negative tumours
