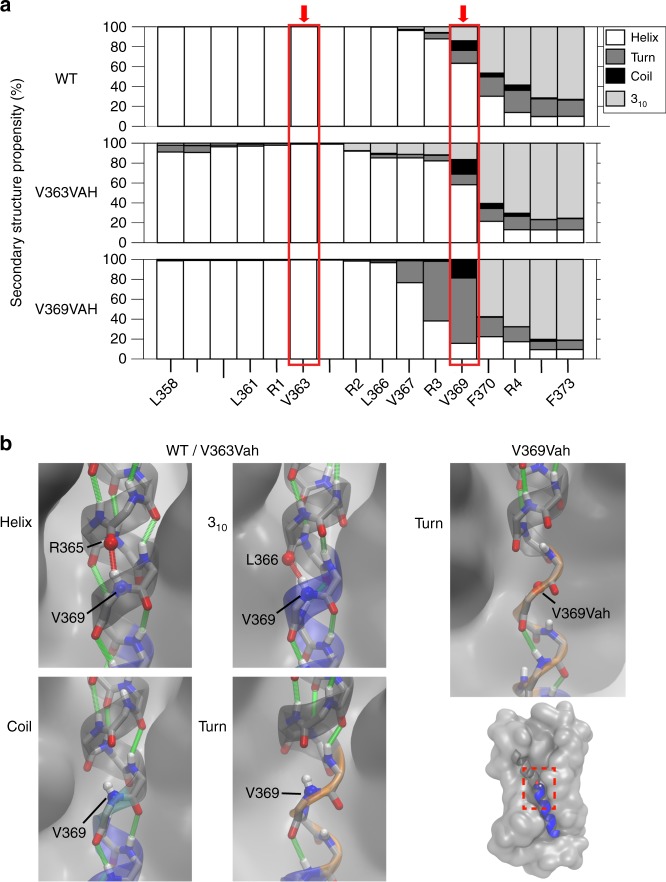
Fig. 5.
Simulations identify secondary structure sampling at the S4 transition region. a Helical content of the S4 segment for WT, V363Vah, and V369Vah shown on top, middle, and bottom panels, respectively. Main-chain structure at V363 and V369 highlighted by red boxes. Top, WT S4 maintains the α-helical (white) and 310 elements at the N- and C-termini, and highlights helical sampling at V369—the transition point. Middle, V363Vah recapitulates WT S4 structural elements. Bottom, V369Vah displays a localized loss of helical structure. b Representative snapshot images from the simulations for WT, 363Vah (left), and 369Vah. Main-chain structure is represented by the transparent cartoon overlay and main-chain H-bonds are indicated by red and green lines

