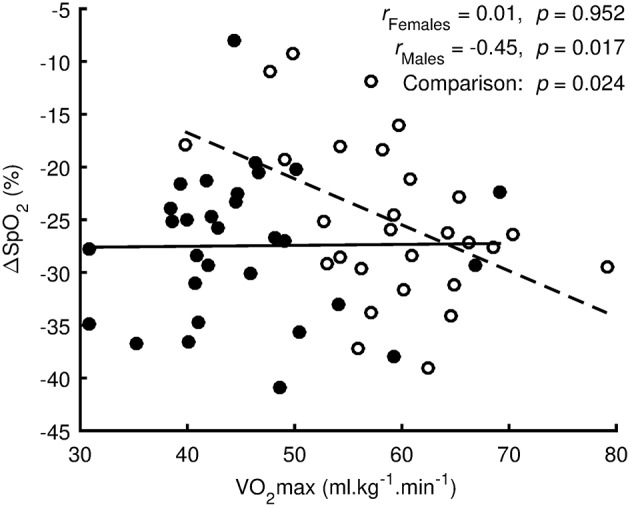
Figure 3.

Regression analysis between oxygen desaturation (ΔSpO2 = SpO2 Hypoxia-SpO2 Preliminary) and the maximal oxygen uptake (VO2max) measured in normoxia. Values of females are denoted by filled circles and solid line. Values of males are denoted by open circles and dashed line.
