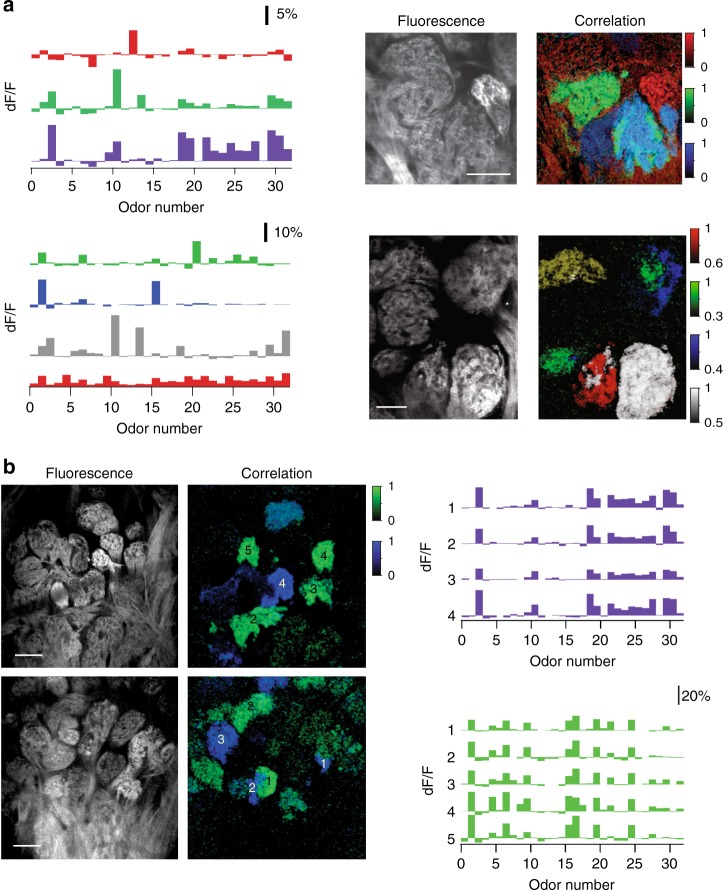
Fig. 3.
Local functional glomerular duplications in OMP–/– mice. a (Left) Example average odor response spectra of PCA-identified functional clusters corresponding to glomerular microdomains from two different fields of view (top vs. bottom). (Right) Corresponding resting fluorescence and overlay of correlograms. Note the presence of functionally homogeneous and heterogeneous glomeruli adjacent to each other. For example, in the lower panel, six anatomically identifiable glomeruli are discernable. The correlograms (Right) indicate that green microdomains are shared between two close-by anatomical glomeruli. White and red microdomains mix within one anatomical glomerulus. The white cluster is also present as a spatial-functional homogeneous adjacent glomerulus. Color scale units are correlation coefficient. Scale bar, 50 μm. b Two partially overlapping example fields of view in one OMP–/– mouse. (Left) Resting glomerular fluorescence. (Center) Correlograms: colors correspond to functionally matched glomeruli or subglomerular microdomains. (Right) Odor response spectra for the green and blue glomeruli. Numbers correspond to the location of the functionally similar glomeruli in the sampled fields of view. Color scale units are correlation coefficient. Scale bar, 80 μm

