Fig. 4.
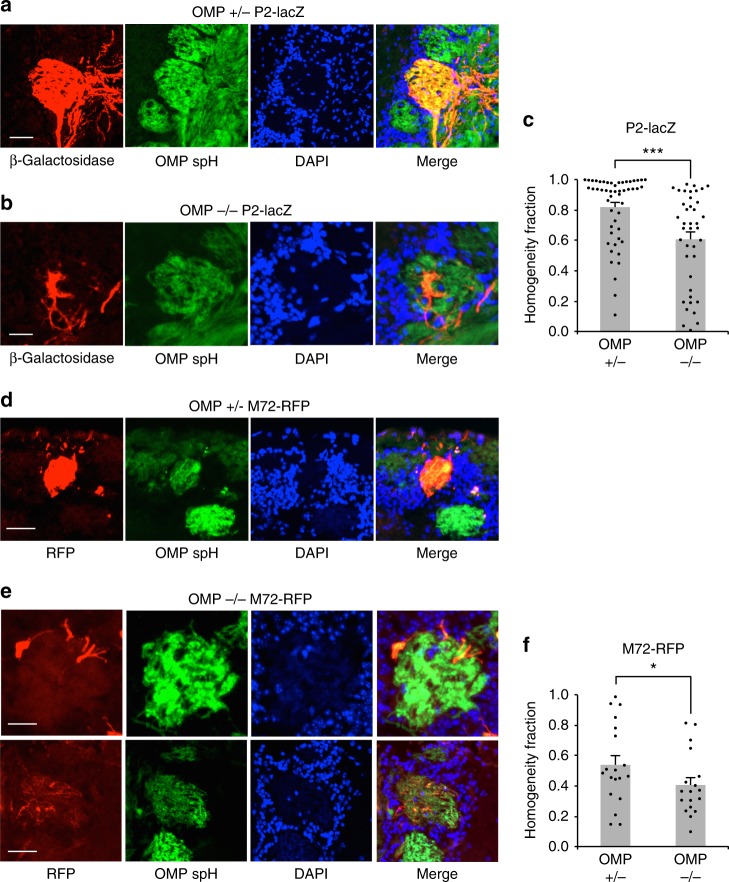
Anatomical glomerular heterogeneity in OMP–/– mice. a Example homogeneous glomerulus in a P2-lacZ OMP+/– mouse. P2-positive OSN axons labeled with β-Gal (red), SpH-positive OSN axons (green) and glomerular outline by DAPI-stained nuclei of juxtaglomerular cells (blue). Note the high overlap between the red and green pixels in the merged image. Scale bar, 50 μm. b Example heterogeneous glomerulus in a P2-lacZ OMP–/– mouse. P2-positive OSN axons labeled with β-Gal (red) do not overlap entirely with SpH-positive OSN axons (green) and only partially fill the glomerulus, outlined by DAPI-stained nuclei of juxtaglomerular cells (blue). Scale bar, 50 μm. c Quantification of glomerular homogeneity (P2-lacZ) in the OMP+/– versus OMP–/– mice. Homogeneity fraction: 0.82 ± 0.03 (mean ± SEM, n = 52 glomeruli) in OMP+/– mice, and 0.61 ± 0.05 (mean ± SEM, n = 40 glomeruli) in OMP–/– animals. Scale bar, 50 μm. d, e Same as (a) and (b) an M72-RFP example glomerulus in the OMP+/– and OMP–/– genetic backgrounds. Scale bar, top 25 μm, bottom 40 μm. f Quantification of glomerular homogeneity in M72-RFP OMP+/– versus OMP–/– mice. Homogeneity fraction: 0.54 ± 0.06 (mean ± SEM, n = 19 glomeruli) in OMP+/– mice, and 0.41 ± 0.05 (mean ± SEM, n = 18 glomeruli) in OMP–/– animals; *p < 0.05, ***p < 0.001, Kolmogorov–Smirnov test

