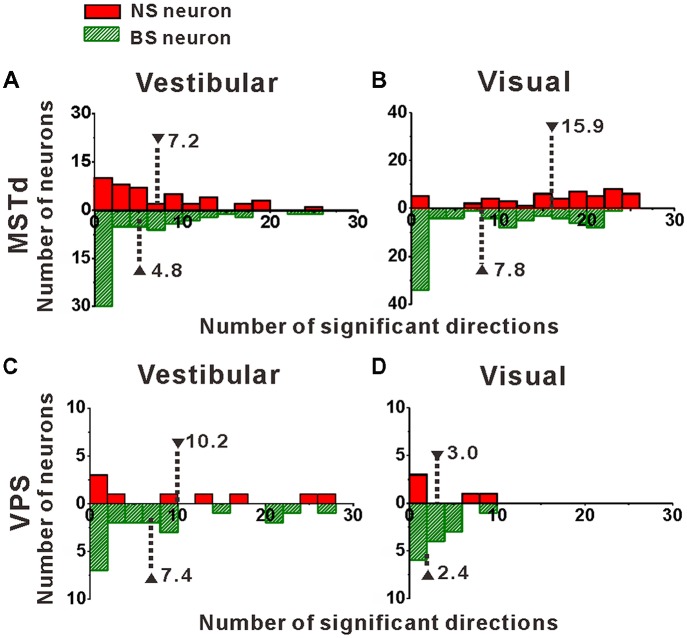
Figure 4.
Distribution of the number of significant directions. (A,B) Distribution histogram of the number of neurons that have a significant response to vestibular (A) and visual stimuli (B) for NS and BS neurons in MSTd. A total of 45 NS neurons and 61 BS neurons with significant directional tune to vestibular stimuli were selected (both p < 0.05, ANOVA test) and a total of 52 NS neurons and 83 BS neurons with significant directional tune to visual stimuli were selected (both p < 0.05, ANOVA test). (C,D) Distribution histogram of the number of neurons that have a significant response to vestibular (C) and visual stimuli (D) for NS and BS neurons in VPS. The neurons analyzed in the graph have a significant directional tune to vestibular or visual stimuli (both p < 0.05, ANOVA test). Vestibular tuning: NS neuron (N = 13), BS neuron (N = 7). Visual tuning: NS neuron (N = 22), BS (N = 19). Note that the number of significant direction distributions for BS neurons were plotted as downward projecting histograms simply for illustrative purposes.

