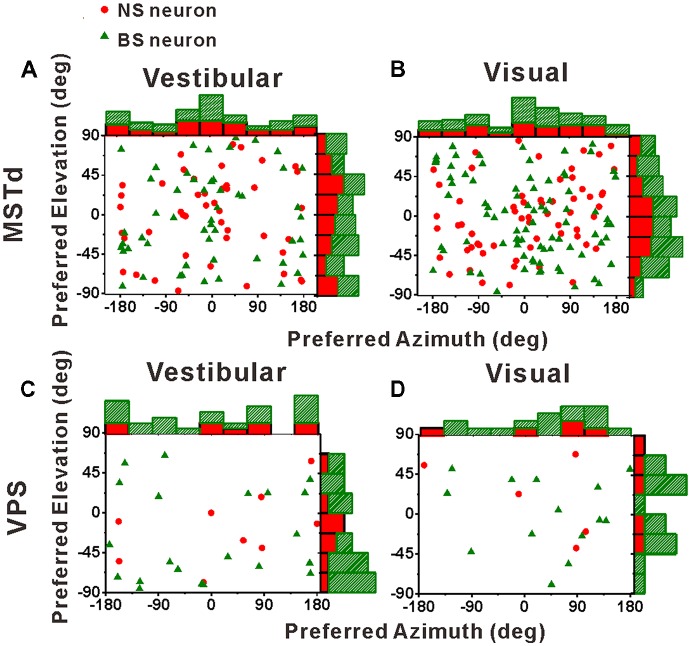
Figure 5.
Distributions of 3D heading preferences for NS (red) neurons and BS (green) neurons in areas MSTd (A,B) and VPS (C,D) in response to vestibular and visual stimuli. Each data point in the scatter plot corresponds to the preferred azimuth (abscissa) and elevation (ordinate) of a single neuron with significant heading tuning. Histograms along the top and right sides of each scatter plot show the marginal distributions. The neurons analyzed in the graph have a significant directional tune to vestibular or visual stimuli (both p < 0.05, ANOVA test). The number of neurons were same as in Figure 4.

