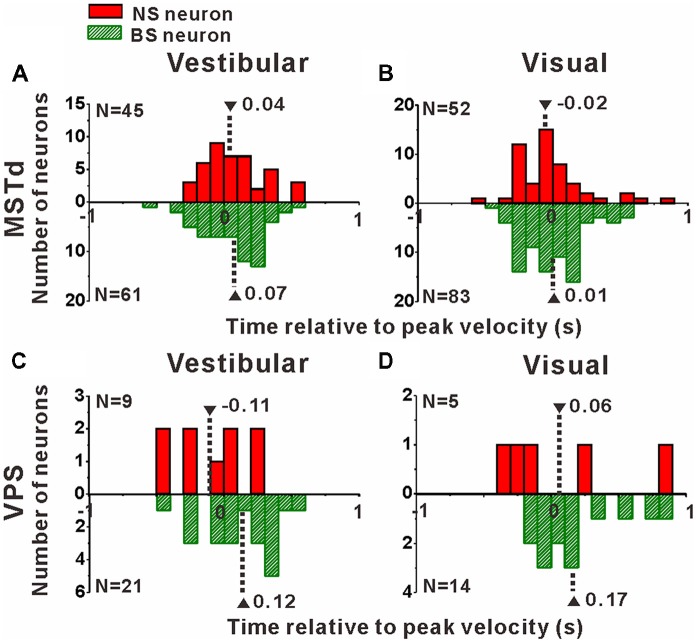
Figure 8.
Peak times of the NS (red) neurons and BS (green) neurons in areas MSTd (A,B) and VPS (C,D) under the vestibular and visual conditions. The neurons analyzed in the graph have a significant directional tune to vestibular or visual stimuli (both p < 0.05, ANOVA test). The number of neurons were same as in Figure 4. Note that the number of significant direction distributions for BS neurons were plotted as downward projecting histograms simply for illustrative purpose.

