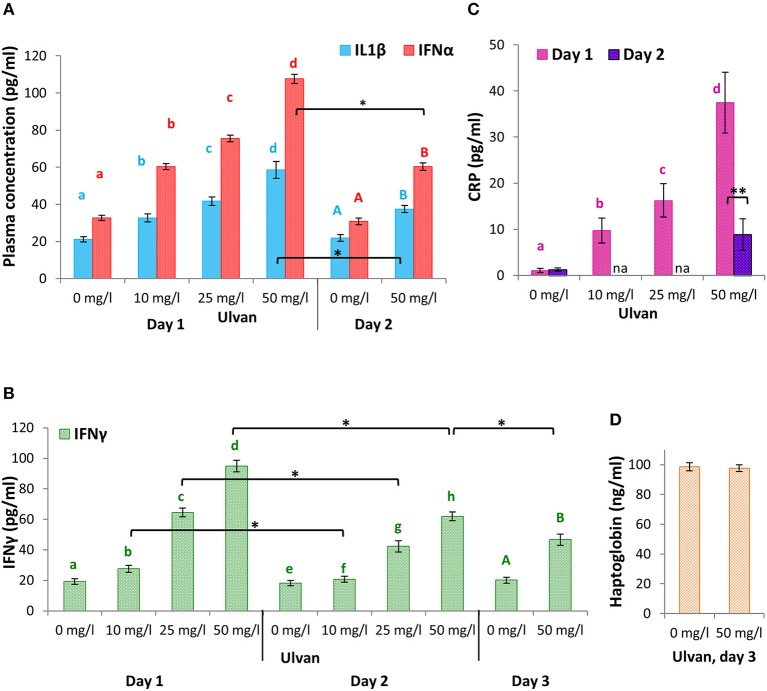
Figure 7.
IL1β, IFNα, and IFNγ are released in a context of transient and moderate inflammation context. Ulvan was given per os at four different concentrations (0, 10, 25, 50 mg/l) to the animals at day 0. Blood samples (1 ml per animal) were taken every day from day 0 to day 3. ELISA were performed on each plasma to quantify the concentrations of IL1β and IFNα (A), IFNγ (B), C-Reactive Protein (C), and haptoglobin (D). Data represents the mean ± SEM of three independent experiments with 25 chickens per group. Different letters with the same color indicate statistically different values for the different doses at the same time with p < 0.05. *p < 0.05, when values are statistically different for the same dose at different times.

