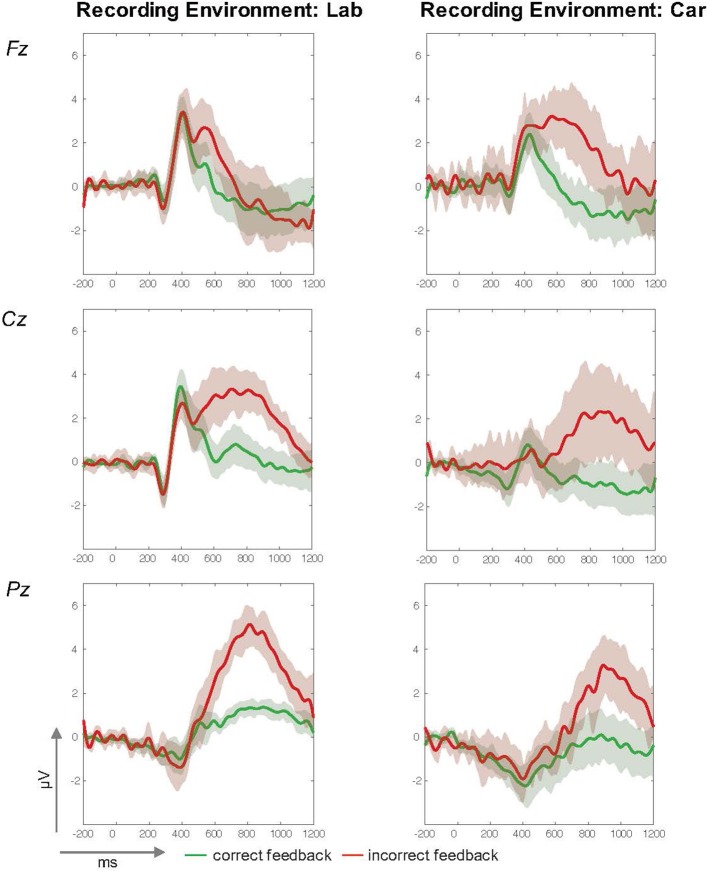
Figure 6.
ERP-traces (in μV, y-axis and time in ms, x-axis) from the laboratory (left column) and driving (right column) studies at midline electrodes Fz (Top), Cz (Middle), and Pz (Bottom). Mean amplitude courses for correct feedback are green and for incorrect Feedback they are red. A 95%-confidence interval for each condition is indicated by the surrounding envelope in the corresponding color.

