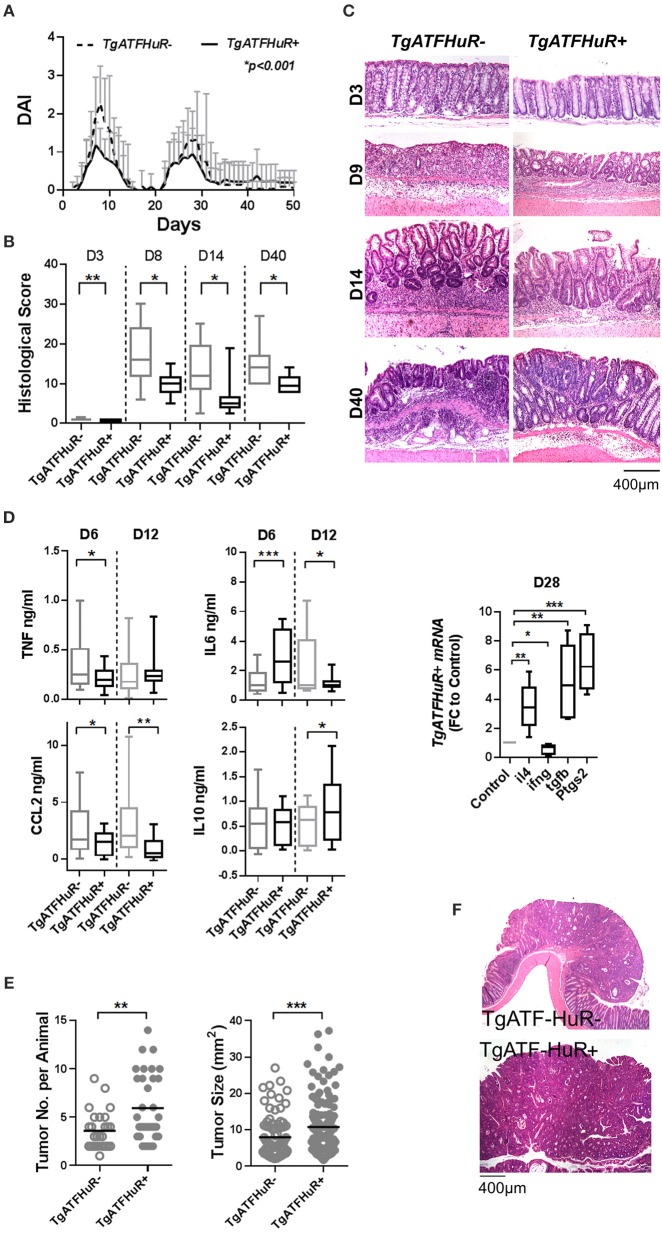
Figure 5.
The combinatorial elevation of HuR attenuates chemically-induced colitis but augments CAC. (A) Macroscopic Disease Activity Index (DAI) during the 2 rounds of DSS administration (Days 0 and 20) in TgATFHuR− and TgATFHuR+ mice. Line graphs depict mean values (±SD). n = 20–30/group. Kolmogorov-Smirnov test. (B) Histological scores of colitis at the indicated time points. Box plots show range and median. n = 8–12 mice/group. (C) Representative histology (H&E) of slides scored in (B). (D) (Left and middle columns) ELISA quantification of inflammatory mediators in colon cultures isolated from DSS-treated mice at the indicated time points. Box plots show range and mean values. n = 3 cultures/group/time point. Student unpaired t-test. (Right) qPCR analysis of RNAs from DSS-treated colons of IEC-HuRko mice on day 28 after treatment expressed as fold change (FC) relative to control mice. il4, interleukin 4, ifng, interferon gamma, tgfb, transforming growth factor beta, Ptgs2, Prostaglandin-Endoperoxide Synthase 2. (E) Graphs depicting tumor number per mouse (left) and tumor size (right) in TgATF− and TgATFHuR+ mice 60 days after challenge with DMH/DSS. Dots represent individual mice (left) and tumors (right); horizontal lines represent means. Student unpaired t-test. (F) Representative histology (H&E) of paraffin embedded colonic tumors measured in (E). In all graphs, *, **, ***, denote p-value < 0.05, 0.01, and 0.001 respectively.

