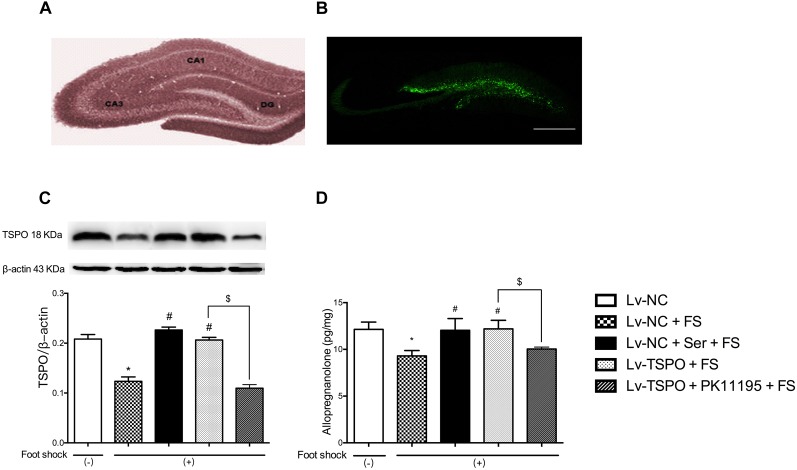
FIGURE 2.
Effects of lenti-GFP-TSPO on expression of TSPO and level of Allo in the DG of mice. (A,B) Fluorescence microscopy captured the microinjection sites shown as expression of GFP in the DG; Scale bars = 500 mm; n = 3. (C) Representative immunoblots of TSPO and the histogram represents semi-quantitative results of western blot analysis. The protein expression of TSPO were normalized by β-actin; n = 3; (D) The level of Allo of hippocampal tissues; n = 3. Data were presented as the means ± SEM. ∗P < 0.05 compared with the Lv-NC+foot-shock (–) group; #P < 0.05 compared with the Lv-NC+FS group; $P < 0.05 compared with the Lv-TSPO+FS group.

