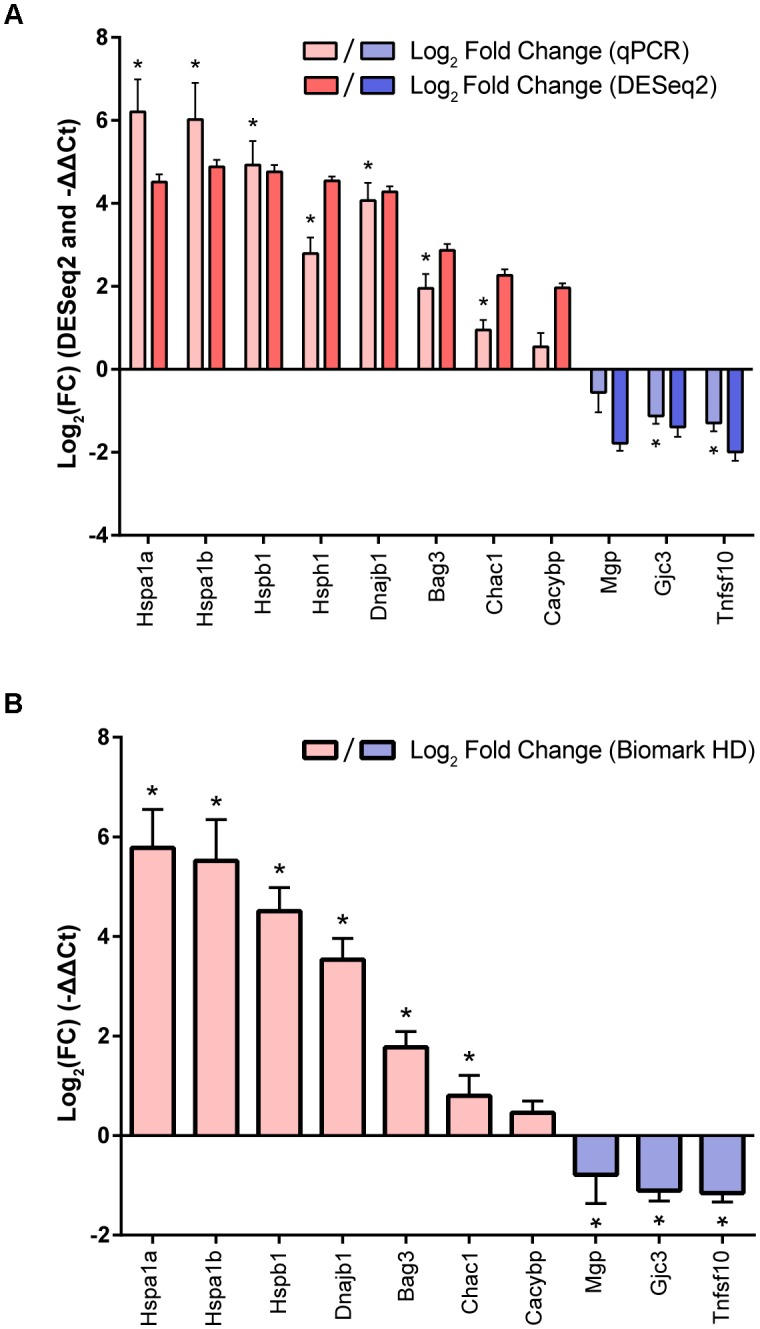
FIGURE 2.

Validation of the utricle heat shock transcriptional signature. (A) Fold changes (mean ± standard error values calculated from the DESeq2 model) of eight enriched and three depleted DEGs from the heat shock transcriptional signature are shown in dark red and dark blue, respectively. RT-qPCR fold changes (normalized to Actb) performed in independent replicates (n = 3 biological replicates per group) for the same eight enriched and three depleted DEGs are shown in light red and light blue, respectively. (B) Fold changes from independent replicates for seven enriched and three depleted DEGs from the heat shock signature normalized to Gapdh and measured on the Biomark HD system show similar induction patterns as measured in (A). Asterisks indicate statistically significant (p < 0.05) differences in heat shock ΔCt values compared to control replicates as measured by multiple unpaired t-tests following Holm-Sidak multiple comparison correction, represented above each ΔΔCt value.
