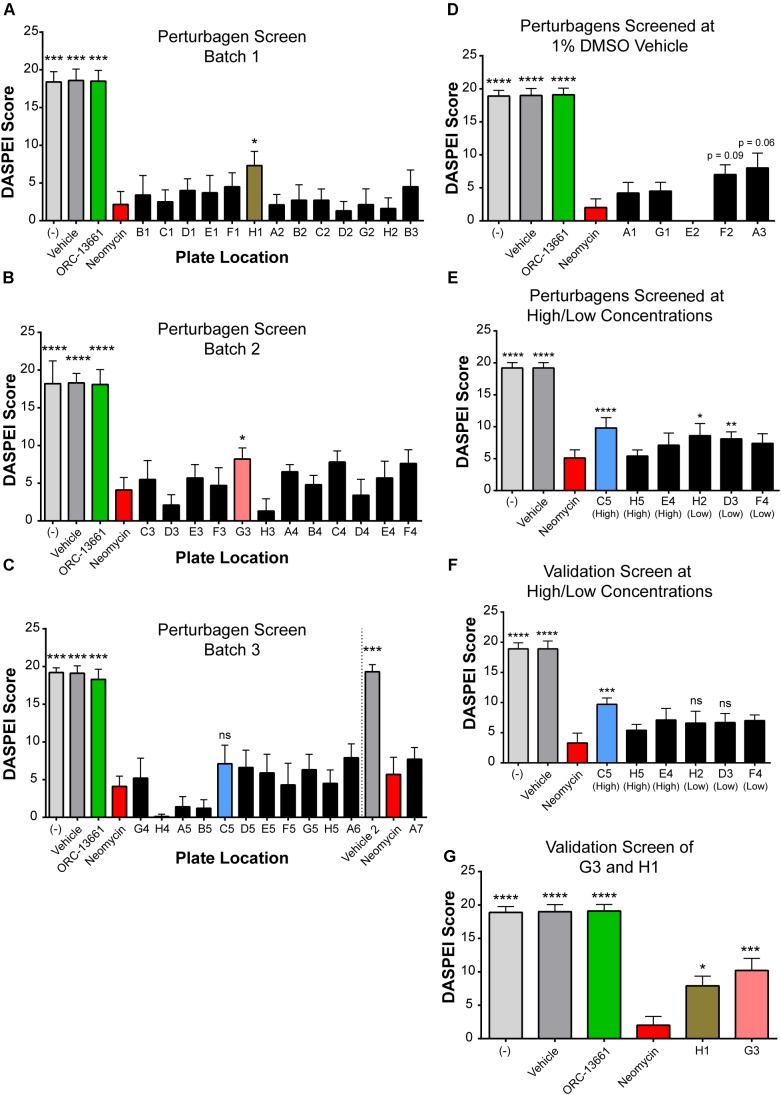
FIGURE 4.
LINCS-identified perturbagen screening in zebrafish revealed three compounds that protect against neomycin-induced hair cell death in lateral line neuromasts. (A–D) DASPEI screening of perturbagens against neomycin-induced ototoxicity in zebrafish neuromasts. Negative controls (–) are shown in light gray (n = 5–10 zebrafish per bar); vehicle controls (0.1–1% DMSO or 0.1% ethanol) are shown in gray (n = 5–10), and positive controls with the otoprotective compound ORC-13661 are shown in green (n = 5–10). 200 μM neomycin (red) resulted in significant hair cell death (n = 10–20). Perturbagens that were either not protective or were protective but failed to replicate in a validation experiment are shown in dark gray. Three perturbagens, designated according to their locations on the culture plate as C5 (blue), G3 (pink), and H1 (brown), were protective against neomycin-induced hair cell death in this screen (n = 10 for all perturbagen treatment bars). (A) DASPEI scores from the first screen of perturbagens tested at 10 μM against 200 μM neomycin. H1 (AT-13387, brown) was protective in this batch. (B) DASPEI scores from the second batch of perturbagens screened at 10 μM against 200 μM neomycin. G3 (Pifithrin-μ, pink) was identified as a protective hit in this batch. (C) Third batch of compounds screened at 10 μM against 200 μM neomycin. C5 (AEG 3482, blue) was later identified as a hit at a different concentration but was not significantly protective at 10 μM (p > 0.05). (D) Remaining batch of perturbagens screened at 1% DMSO and 10 μM concentration to increase solubility. (E) DASPEI scores using a batch of compounds at alternative high or low doses. C5 was identified as a hit at 30 μM. (F) DASPEI scores from the C5 validation screen of alternative high or low dose compounds. (G) DASPEI scores from the validation experiment for 10 μM H1 and 10 μM G3 hits demonstrating a repeatable protective effect against 200 μM neomycin. Asterisks represent adjusted p-values for Dunn’s multiple comparisons test following a Kruskal–Wallis test for treatment with ∗ representing p ≤ 0.05, ∗∗ representing p ≤ 0.01, ∗∗∗ representing p < 0.001, ∗∗∗∗ representing p < 0.0001, and ‘ns’ (not significant) representing p > 0.05. All error bars in (A–G) represent ± SD values.

