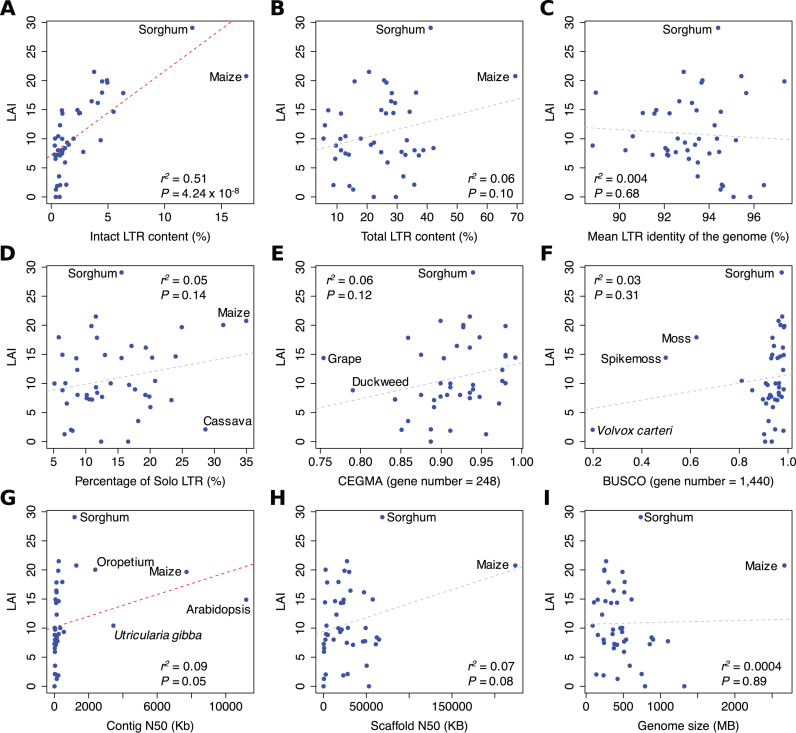
Figure 2.
Relationships between LAI and other genome metrics among genomes with variable assembly quality. LAI is significantly correlated with (A) intact LTR-RT content (r2 = 0.51) and marginally correlated with (G) contig N50 (r2 = 0.09) and (H) scaffold N50 (r2 = 0.07). LAI is independent of (B) total LTR-RT content, (C) the mean LTR identity of the genome, (D) percentage of solo LTR among all LTR-RT sequences, (E) CEGMA completeness of 248 genes, (F) BUSCO completeness of 1,440 genes and (I) haploid genome size (P ≥ 0.10). Each dot represents a plant genome (n = 44) that contain > 5% of LTR sequence. The coefficient of determination (r2) and F-test P value between x- and y-axis are indicated on each plot with outliers also indicated. Significant and non-significant linear regressions are indicated in red- and gray-dotted lines, respectively.

