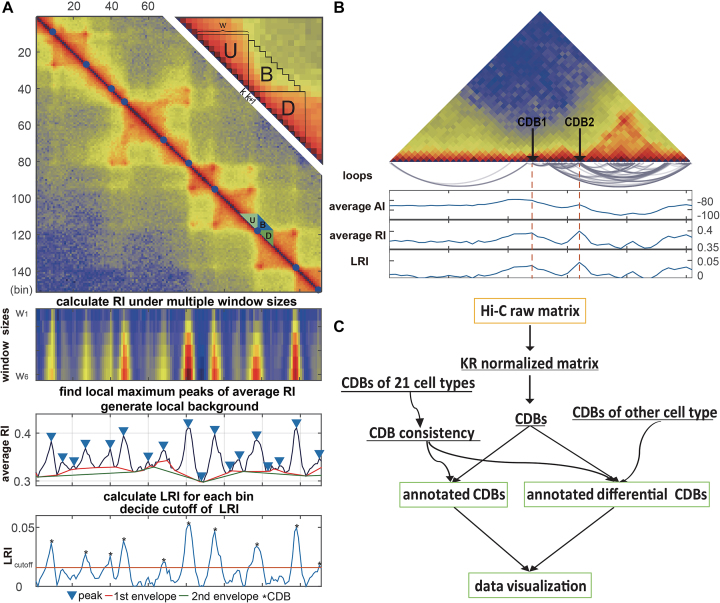
Figure 1.
Overview of the HiCDB method. (A) HiCDB method workflow. This region is extracted from the 10-kb GM12878 Hi-C matrix. The detected CDBs are shown as blue dots in the heatmap. The upper right quadrant shows how to calculate the relative insulation in detail. The panels under the Hi-C contact map show the process of how to calculate the RI and LRI. (B) Schematic representation of the difference between AI, RI and LRI. CDB1 represents a CDB with high AI and high LRI. CDB2 represents a CDB with low AI but high LRI in a highly connected region. (C) A summary of the HiCDB analysis pipeline. This flowchart presents the main features and the sequential operations of HiCDB software. The yellow squares are input data, and green squares represent optional outputs. Curves with arrowheads represent optional steps.

